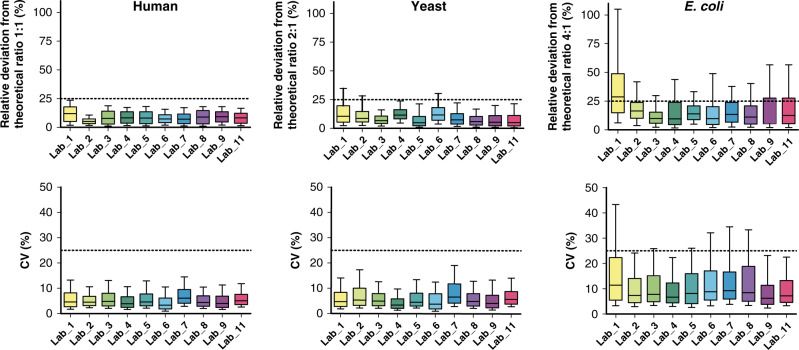
Fig. 5. Quantitative performance metrics from analyses of the mixed proteome samples.
The evaluation was based on the experimentally determined abundance changes of the systematically quantified proteins (every day by every laboratory) between controlled samples A and B (n = 4565) using three technical replicates. In the upper panels, the distribution of deviation from theoretical protein abundance changes for the three organisms (in %) was plotted for each laboratory through boxplots with center line, box bounds, and whiskers representing the median, 1st/3rd quartile, and 10th/90th percentile, respectively. Horizontal dashed lines were added at 25% relative deviation, as a reference value. In the lower panels, the distribution of the coefficients of variation obtained on the determined protein abundance changes for the three organisms across the various evaluation days (CV in %) was plotted for each laboratory through boxplots with center line, box bounds, and whiskers representing the median, 1st/3rd quartile, and 10th/90th percentile, respectively. Horizontal dashed lines were added at 25% CV, as a reference value. Source data are provided as a Source Data file.

