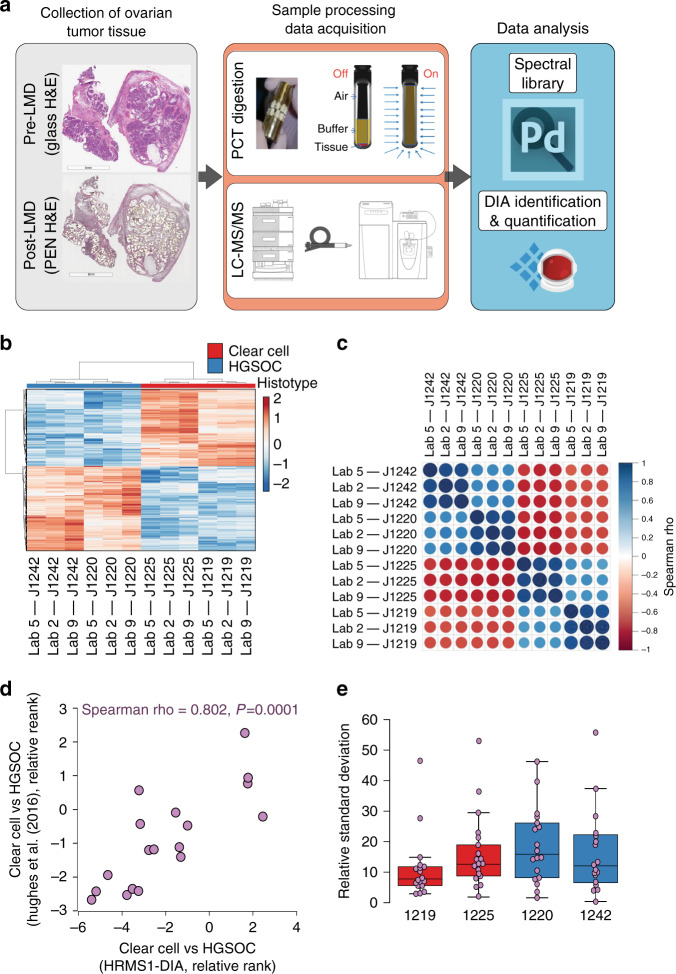
Fig. 6. Archival ovarian cancer tissue sample analysis using HRMS1-DIA at three analytical sites.
a Epithelial cancer cells were laser microdissected from formalin-fixed, paraffin-embedded (FFPE) archival ovarian clear cell carcinoma (OCCC, n = 2) and high-grade serous ovarian carcinoma (HGSOC, n = 2) tumor, digested by pressure-cycle technology, and evaluated by three international labs using the standardized HRMS1-DIA analytical workflow. Each biological sample was analyzed by HRMS1-DIA as three technical replicates. Quality control standards were evaluated before, between, and after the archival cancer tissue samples. The data acquisition was performed in a 24/7 operation mode. b Unsupervised cluster analysis of 394 proteins that were significantly altered (LIMMA adjusted p value < 0.01) between OCCC (red) and HGSOC (blue) tissues. c Correlation plot of proteins significantly altered across analytical sites and disease histotypes. d Correlation of proteins identified as altered in OCCC and HGSOC tissues in this study with a gene signature identified by Hughes et al.32. We co-quantified 18 significant protein alterations (LIMMA p value < 0.05) with this historic 112 gene signature stratifying OCCC and HGSOC ovarian cancers. Protein alterations were significantly correlated with this feature subset (Spearman = 0.802, p = 0.0001). e Quantitative reproducibility of 18 OCCC and HGSOC signature proteins across three analytical sites by patient tissue sample (n = 2 unique OCCC and n = 2 unique HGSOC patients). The figure shows the relative standard deviation between protein abundances obtained for the 18 signature proteins quantified at the three analytical sites. Boxplots reflect median RSD at midpoints as well as upper and lower limits of interquartile RSD range.

