
Fig. 5. Growth rate dependences of total RNA/protein ratio and ribosome activity.
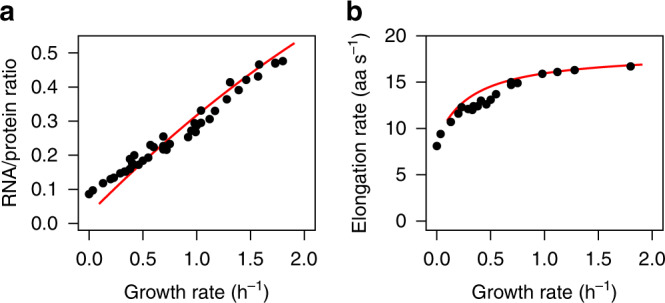
a Predicted total RNA concentration (mRNA + tRNA + rRNA) relative to observed total protein concentration at different cellular growth rates (red line) compared to experimental observations5,32; R2 = 0.97, GMFE = 1.12. b Predicted (red line) and experimentally determined32 elongation rates of actively translating ribosomes (ribosome activities); R2 = 0.93, GMFE = 1.06. At the lowest assayed growth rates, non-growth-related translation—which is not included in the model—may become comparable to growth-related translation; at these growth rates, the numerical optimization of our model did not converge (μ < 0.1 h−1), and thus the red lines are not extended into this region. Source data are provided as a Source Data file.