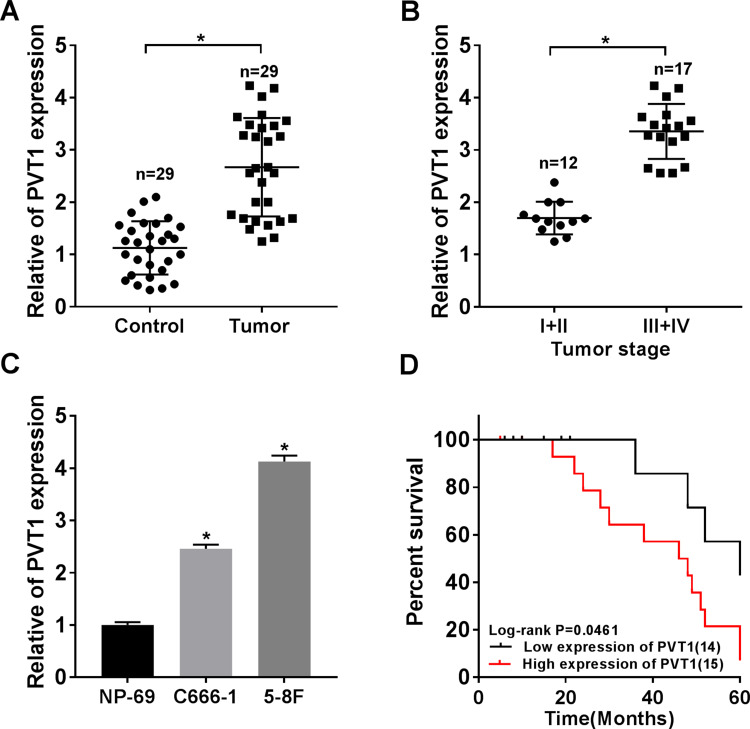
Figure 1.
PVT1 was highly expressed in NPC tissues and cells. (A) The expression level of PVT1 was detected by qRT-PCR in NPC tissues (n = 29) and normal tissues (n = 29). (B) The level of PVT1 in different TNM stages was checked by qRT-PCR. (C) The level of PVT1 in normal cell line and NPC cell lines was measured by qRT-PCR. (D) The Kaplan–Meier method was utilized to estimate overall survival and the Log rank test was used to evaluate the differences between survival curves. Patients were divided into PVT1 high (n = 15) and PVT1 low (n = 14) groups by median value of PVT1 expression. *P < 0.05.

