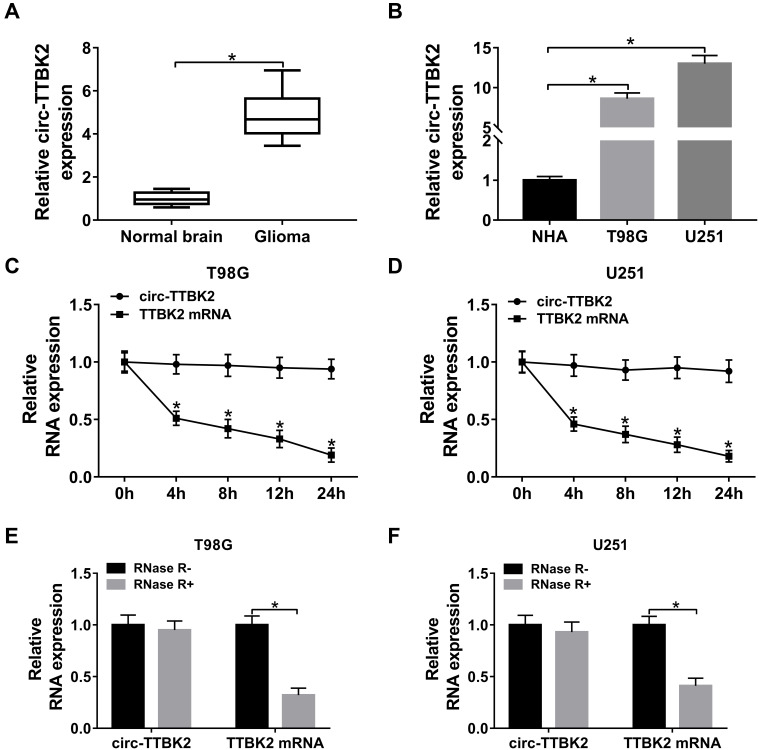
Figure 1.
The level of circ-TTBK2 in glioma tissues and cells. (A) The level of circ-TTBK2 was detected in glioma samples and normal brain samples via qRT-PCR. n=30. (B) The expression of circ-TTBK2 was examined in glioma cell lines (T98G and U251) and NHA cells via qRT-PCR. (C and D) The levels of circ-TTBK2 and TTBK2 mRNA were measured in T98G and U251 cells treated by Actinomycin D via qRT-PCR. (E and F) The levels of circ-TTBK2 and TTBK2 mRNA were detected after stimulation of RNase R via qRT-PCR. *P<0.05.

