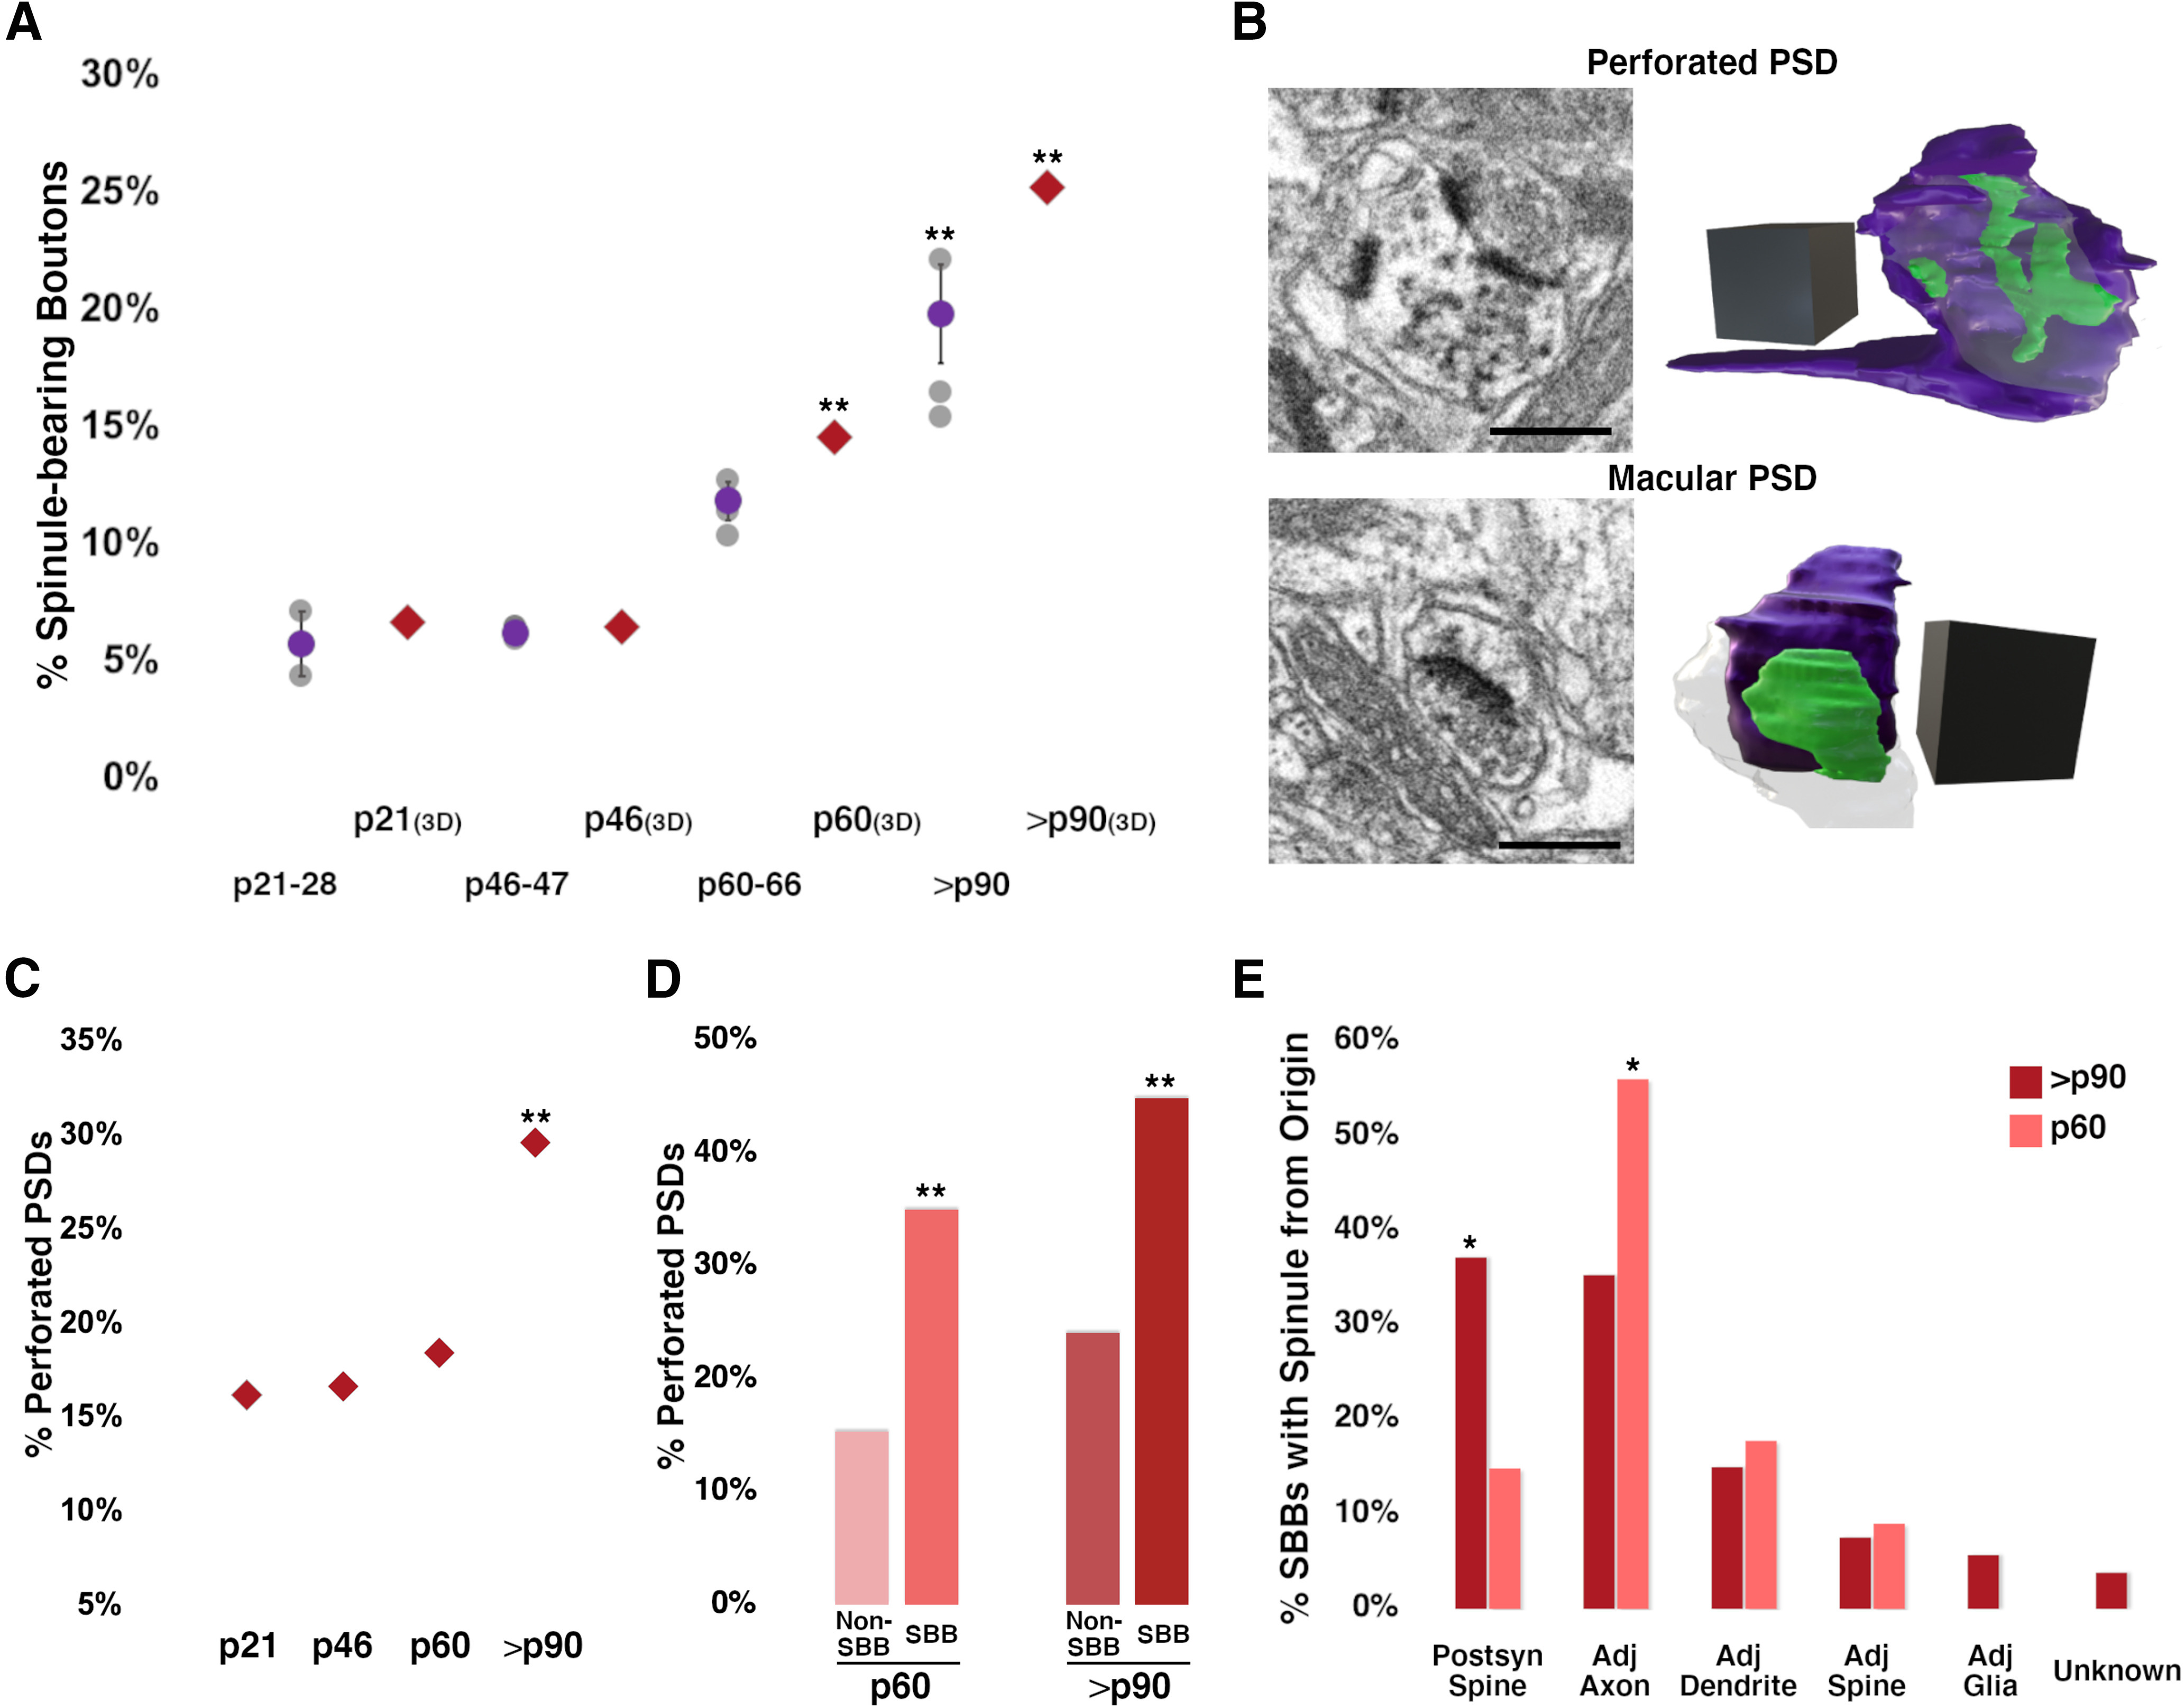
Figure 8.

SBBs progressively engulf spinules as plasticity wanes in V1. A, Percentages of excitatory SBBs across the developmental ages examined in 2D TEM and FIBSEM (3D) images. 3D FIBSEM data at p21, p46, p60, and >p90 are represented by red diamonds, 2D data as shown in Figure 2D. Statistical comparisons were performed between p21 and p46, p46 and p60, and p60 and >p90 (for details, see Table 3). B, FIBSEM images showing an SBB with a synapse onto a postsynaptic spine containing a perforated PSD (top panel), and an SBB with a with a synapse onto a spine displaying a macular PSD (bottom panel). 3D reconstructions of each SBB and their corresponding PSDs are shown to the right. SBBs shown in purple, PSDs shown in green, postsynaptic spines are made transparent to visualize PSDs. Identical SBBs as shown in Figure 7C,D. C, FIBSEM developmental analysis showing the average percentages of excitatory presynaptic boutons with perforated PSDs in L4. D, FIBSEM analysis showing the percentages of SBBs versus Non-SBBs (i.e., excitatory presynaptic boutons without spinules) with perforated PSDs at p60 and >p90. E, FIBSEM analysis showing the percentages of p60 and >p90 SBBs containing at least one spinule from a defined neurite or glial origin. For example, ∼56% of SBBs at p60 contain at least one spinule from an adjacent axon. Scale bars = 0.5 μm for FIBSEM images in B; 3D scale cubes = 0.5 μm3 for FIBSEM reconstructions in B; *p < 0.05, **p < 0.015.
