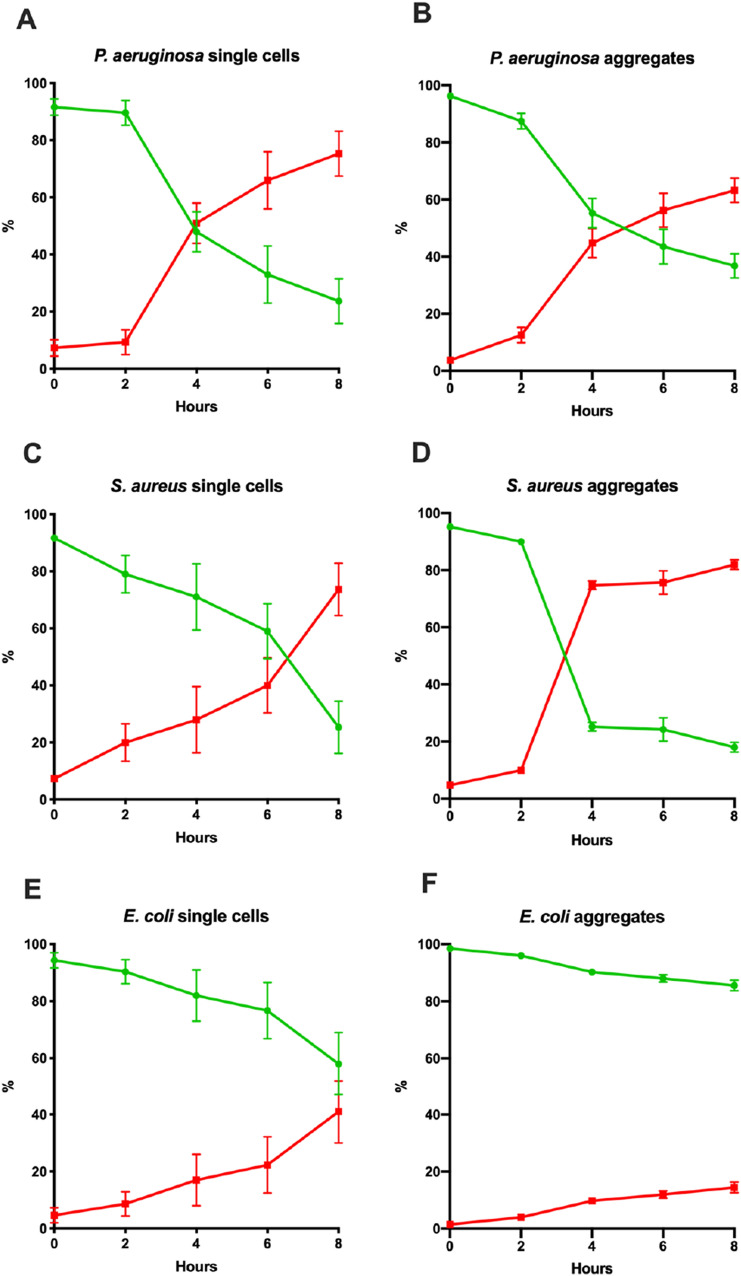
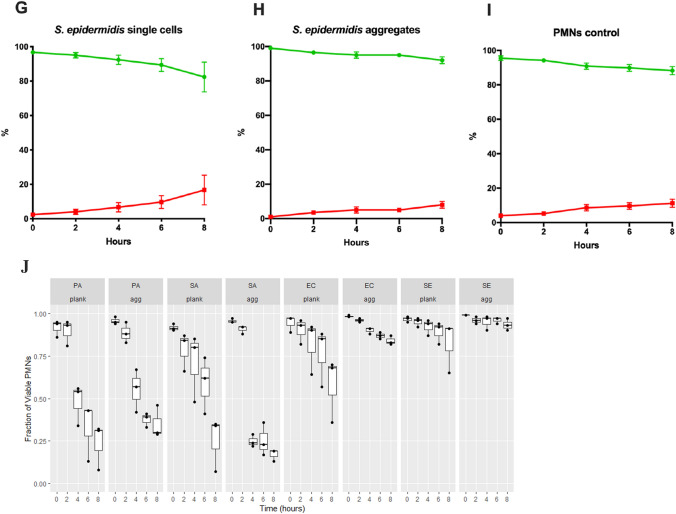
Fig. 3.
a–i Killing of PMNs by the four bacteria when as single cells or aggregates. Single-cell bacteria or aggregated bacteria were inoculated with PMNs at 0 h. At different time points a 2D image was obtained and the ratio of live (green) and dead (red) PMNs were estimated using Imaris software. a, b P. aeruginosa, c, d S. aureus, e, f E. coli, g, h S. epidermidis and i control PMNs. Each point represents the mean of 3–4 experiments together with SEM. j Proportion of viable PMNs compared to total number of PMNs following incubation with single cells or aggregates of P. aeruginosa (PA), S. aureus (SA), E. coli (EC) and S. epidermidis (SE) from 0, 2, 4 and 8 h post-inoculation (n = 3). Box-plots represent the median and inter-quantile range (IQR), while the whiskers represent 1.5*IQR


