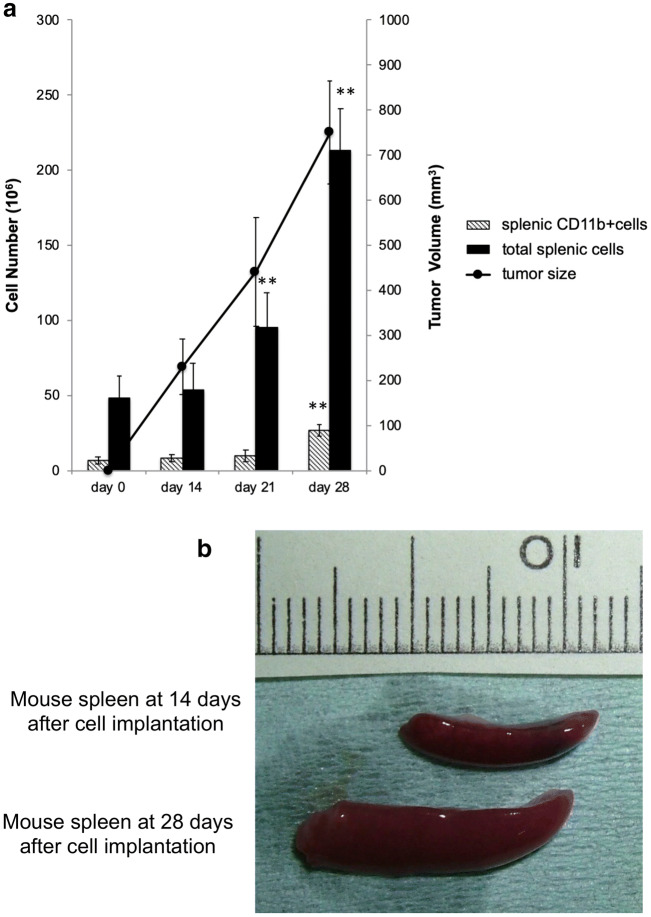
Fig. 1.
Characteristics of splenic CD11b-positive cells during tumor growth a Cell numbers of total splenic cells and splenic CD11b-positive cells (isolated by magnetic beads) from an isogenic graft mouse model during tumor growth. The line graph indicates the tumor volume. b Mouse spleen at 14 days and 28 days after cell implantation. *P < 0.05 and **P < 0.01; Dunnett’s test for day 0 vs. day 14, 21, or 28; days 0, 14, 21, and 28: n = 5/group

