Fig. 3.
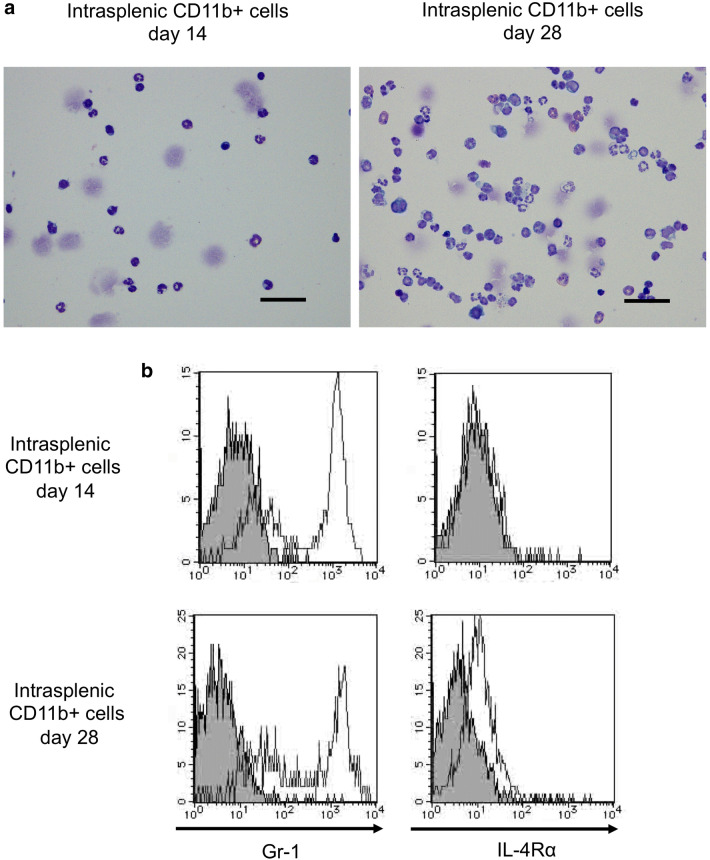
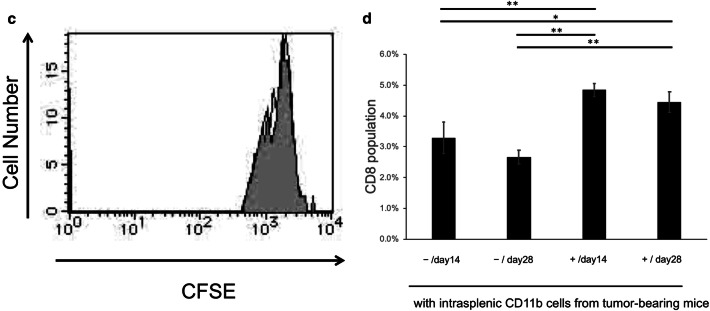
Intrasplenic CD11b-positive cells show increase IL-4Rα expression a May-Giemsa staining of CD11b-positive splenic cells that were isolated at 14 days and 28 days after cell implantation. Magnification, × 400. The scale bar indicates 50 μm. b Flow cytometry analysis of Gr-1 and IL-4Rα in splenic CD11b-positive cells at 14 days and 28 days after cell implantation. c The CD8 inhibitory function assay of splenic CD11b-positive cells from 28 days after cell implantation. CFSE-labeled CD8 cells stimulated with ConA were co-cultured with splenic CD11b-positive cells obtained at 28 days after implantation for 24 h. d The activated CD8 T cell population changes. Splenic cells unstimulated or stimulated by CD3 and CD28 were co-cultured with intrasplenic CD11b+ cells from 14 or 28 days after cell implantation for 24 h. − and + indicate unstimulated splenic cells and CD3/CD28 stimulated splenic cells from normal mice, respectively. *P < 0.05 and **P < 0.01 (Tukey–Kramer test). Representative data from three independent experiments that were repeated three times. One mouse per group was used 14 and 28 days after tumor implantation. One spleen of a normal mouse was used once, and the assay was repeated three times (d)


