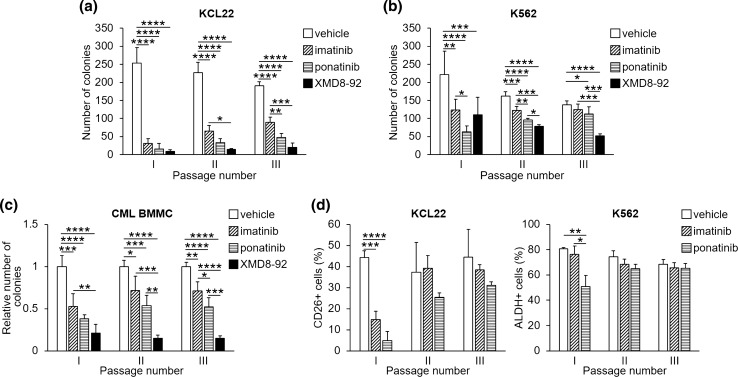
Fig. 6.
Effects of TKi on serial CFA of CML cells. Cells were incubated in semisolid medium and treated with DMSO (vehicle), 1 μM imatinib, 4 nM ponatinib or 10 μM XMD8-92 from time 0 to the end of primary culture (day 7; passage I). Colony cells were rescued and washed to remove drugs and replated (passage II); colony cells from drug-free, day-7 passage II cultures were then replated and incubated for 7 further days (passage III). Colonies were scored on day 7 after each passage. a, b Values are mean ± SD of data from three independent experiments each performed in duplicate. *p < 0.05, **p < 0.01, ***p < 0.001, ****p < 0.0001. c Values are mean ± SD of data, normalized for vehicle-treated control, from three patients, each CFA assay being performed in duplicate. *p < 0.05, **p < 0.01, ***p < 0.001, ****p < 0.0001. Data obtained for individual patients are shown in Supplementary Fig. S4 (see electronic supplementary material). d Expression of CD26 or ALDH activity, respectively, in KCL22 (left) or K562 (right) viable cells rescued from each passage of serial CFA assays shown in a and b. The percentages of cells expressing CD26 or ALDH activity as determined by flow cytometry from three independent experiments (mean ± SD) are shown. *p < 0.05, **p < 0.01, ***p < 0.001, ****p < 0.0001; ALDH aldehyde-dehydrogenase, CFA colony formation ability, CML chronic myeloid leukemia, DMSO dimethyl-sulfoxide, TKi tyrosine kinase inhibitors

