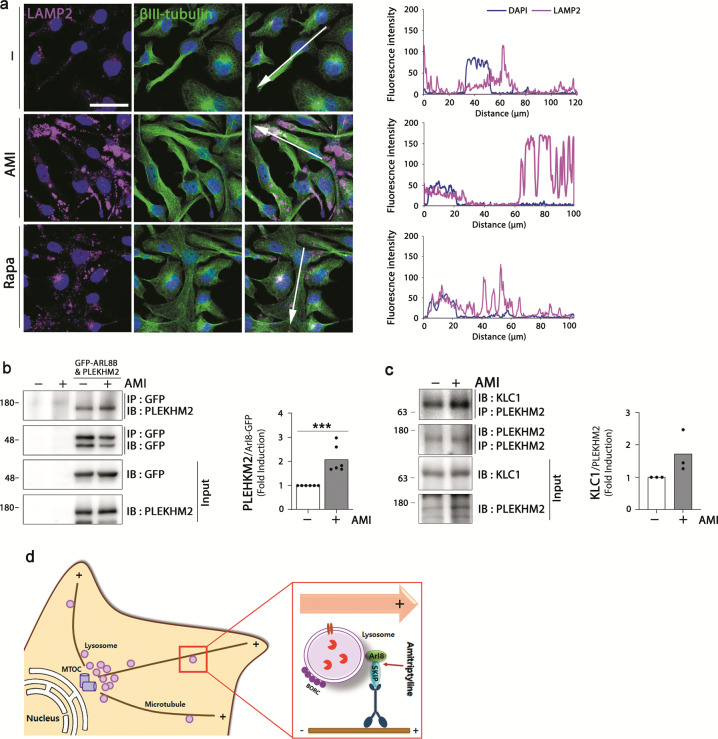
Fig. 5. Effect of amitriptyline on lysosome distribution.
a Differentiated SH-SY5Y cells were treated with amitriptyline (20 μM) or rapamycin (2.5 μM) for 24 h and analyzed LAMP2 and βIII-tubulin localization by immunofluorescence. Scale bar corresponds to 50 μm. Quantification of LAMP2 and DAPI intensity along the arrow line in a is shown in the right panel. b HEK-293T cells were transiently transfected with Arl8-GFP and PLEKHM2 and treated with 20 μM amitriptyline for 24 h. The binding of Arl8 and SKIP/PLEKHM2 in cells was analyzed by immunoprecipitation with anti-GFP and immunoblotting with anti-PLEKHM2. Quantification of PLEKHM2 per Arl8-GFP is shown in the right panel (n = 6). c HEK-293T cells were treated with amitriptyline for 24 h and the binding of KLC1 and PLEKHM2 in cells was analyzed by immunoprecipitation. Quantification of KLC1 per PLEKHM2 is shown in the right panel (n = 3). d Schematic diagram showing the effect of amitriptyline on lysosome positioning. ***P < 0.001. AMI amitriptyline, IP immunoprecipitation, IB Immunoblotting, Rapa rapamycin.

