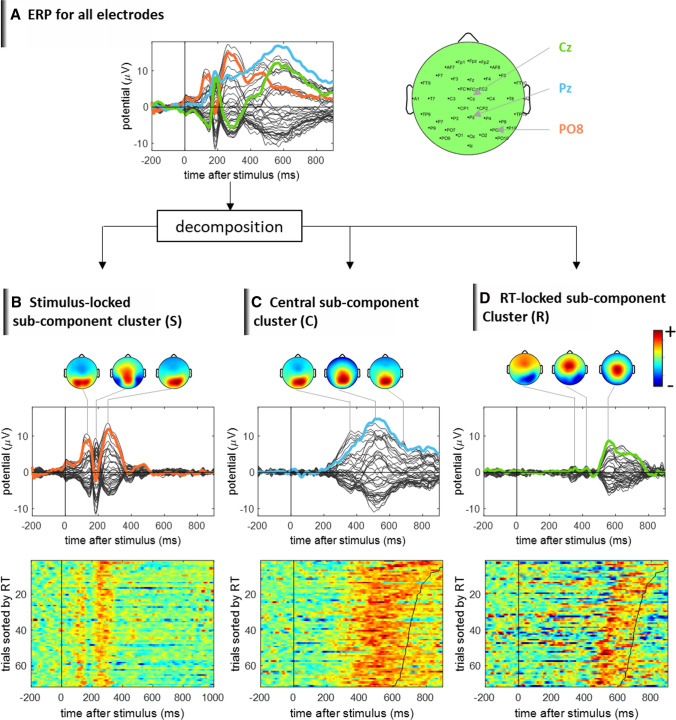
Fig. 4.
Dynamical pattern and trial-to-trial variability of overlapping ERP sub-components. The RIDE method decomposes ERP data into different temporally overlapping sub-component clusters with different features of single trial variability. The framework reveals that some sub-components are stimulus-locked, some are RT-locked and some are in-between, and they can be separated. The separation reveals richer neural dynamical activity pattern that are otherwise mixed and hidden in the stimulus-locked average ERP. The consistency of the separation scenario has been demonstrated elsewhere (Ouyang et al. 2015). Data are from a single subject performing a face recognition task. The time zero indicates the presentation time of the facial stimulus. Vertical black line: stimulus onset. Black curve: RT. The single trials data were normalized in amplitude and filtered under 40 Hz

