Figure 4.

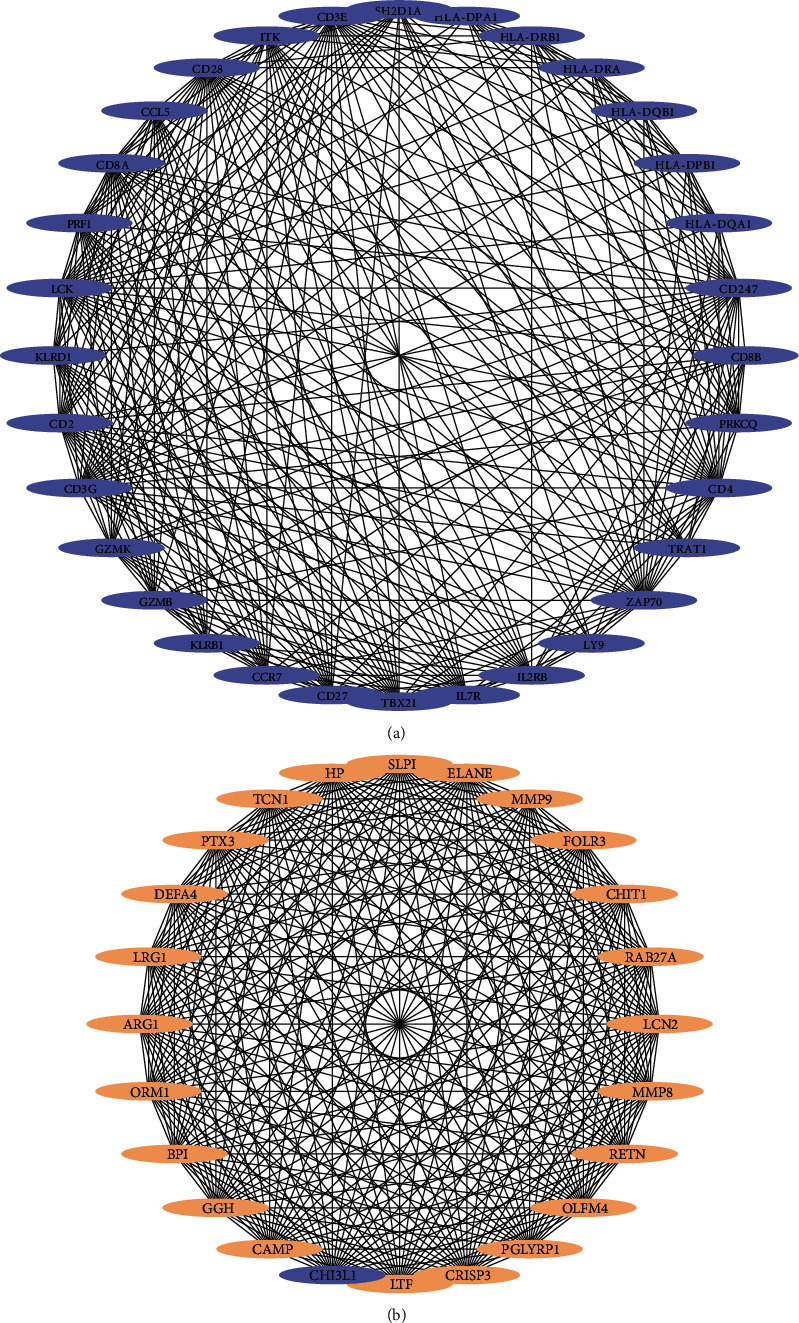
Clusters A and B identified by network analysis. The PPI network is divided into 2 clusters by the MCODE plugin. Light orange and bluish violet represent upregulated and downregulated genes separately.

Clusters A and B identified by network analysis. The PPI network is divided into 2 clusters by the MCODE plugin. Light orange and bluish violet represent upregulated and downregulated genes separately.