Figure 6.

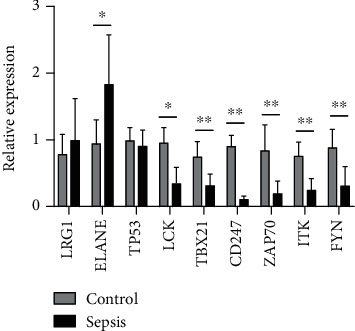
Expression of nine selected key genes was compared between healthy controls and sepsis patients by quantitative real-time PCR. Differences between two groups were analyzed using the t-test. ∗P < 0.05, ∗∗P < 0.01.

Expression of nine selected key genes was compared between healthy controls and sepsis patients by quantitative real-time PCR. Differences between two groups were analyzed using the t-test. ∗P < 0.05, ∗∗P < 0.01.