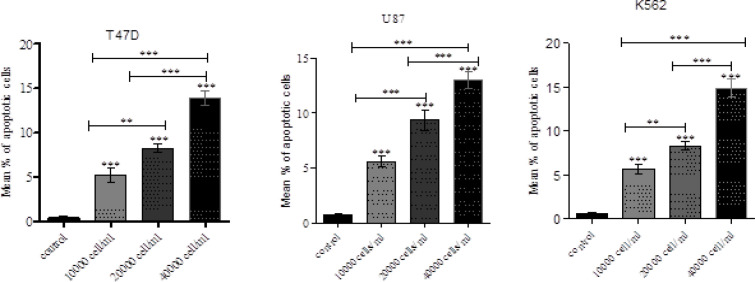
Figure 8.
A. Mean % of Apoptosis in Different Tumor Cells .Mean % of apoptosis increased significantly in all treatment doses. Flow cytometric analysis of apoptosis of different tumor cells treated with NK cells .8B: Mean % of apoptosis in different in different tumor cells. Mean % of apoptosis increased significantly in all treatments doses

