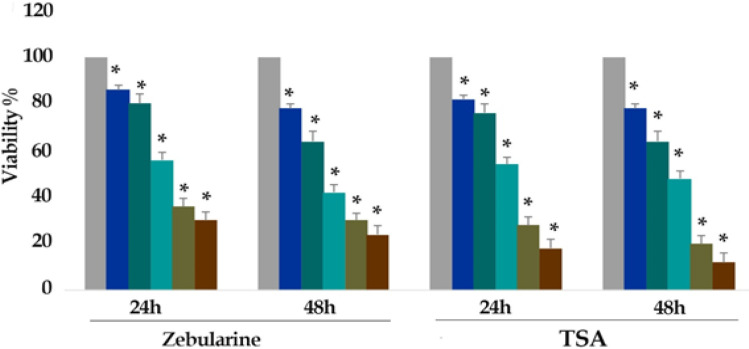
Figure 1.
In vitro Effects of Zebularine (0, 5, 10, 25, 50 and 100 μM) and TSA (0, 1, 2.5, 5, 10, and 25 μM) on LS 180 Cells Viability Determined by MTT Assay at 24 and 48 h. As shown in figure 1, from right to the left, the first column of each group belongs to the control group. Values are means of three experiments in triplicate. Asterisks (*) demonstrate significant differences between treated and untreated control groups

