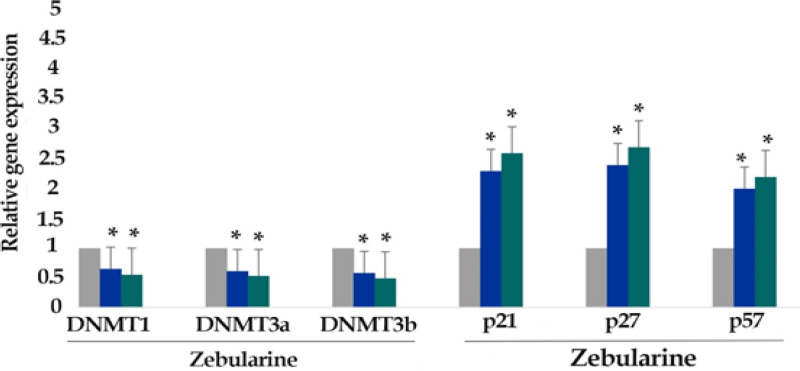
Figure 6.
The Relative Expression Level of DNA Methyltransferases (DNMT1, 3a, and 3b), p21Cip1/Waf1/Sdi1, p27Kip1, and p57Kip2 in the LS 180 cell line treated with zebularine (50 μM) versus untreated control groups at different periods (24 and 48h). The first column of each group belongs to the untreated control group and the others belong to the treated cells with zebularine. Asterisks (*) indicate significant differences between the treated and untreated groups

