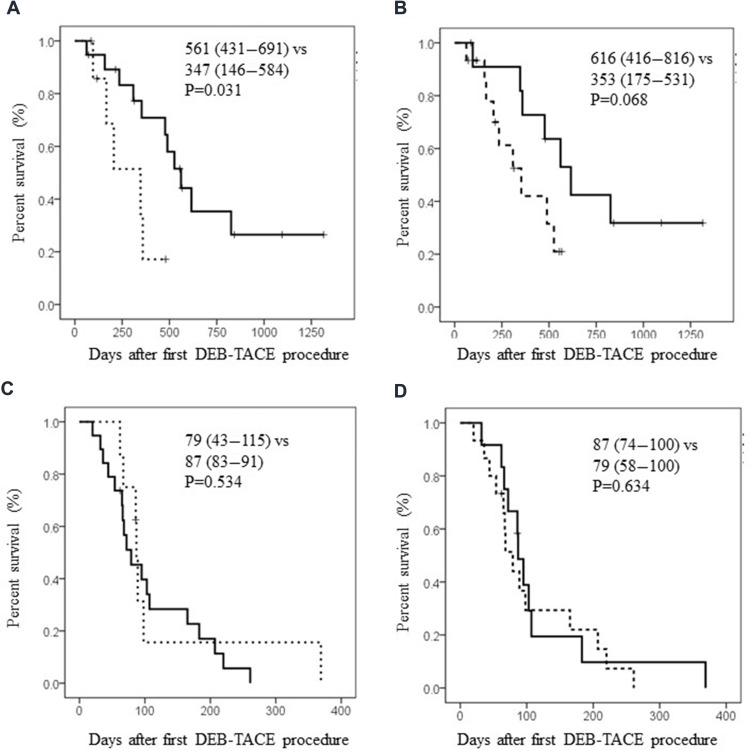
Figure 2.
Kaplan–Meier analyses after DEB-TACE. Median survival time (95%CI) was shown in the column. (A) Overall survival after DEB-TACE according to liver reserve function. Solid line represents survival curve in patients with Child–Pugh A. Dotted line represents that with Child–Pugh B. (B) Overall survival after DEB-TACE according to up-to-seven (UT7) criteria. Solid line represents survival curve in patients with UT7 in. Dotted line represents that with UT7 out. (C) Progression-free survival after DEB-TACE according to liver reserve function. Solid line represents survival curve in patients with Child–Pugh A. Dotted line represents that with Child–Pugh B. (D) Progression-free survival after DEB-TACE according to UT7 criteria. Solid line represents survival curve in patients within UT7. Dotted line represents that without UT7.

