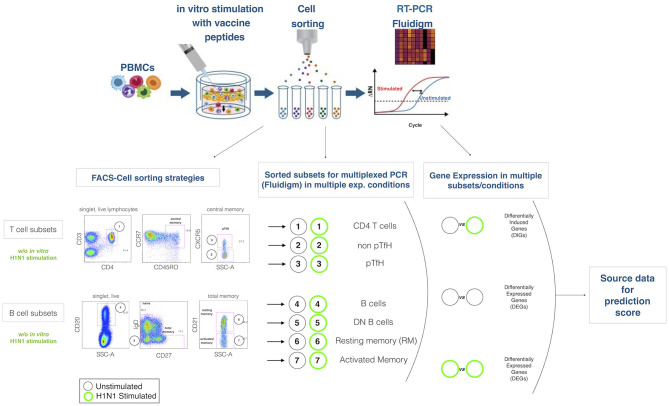
Figure 1.
Experimental design. The cartoon on the top panel depicts the experimental procedure. Briefly, total PBMCs are in 2 aliquotes, one stimulated and the latter unstimulated. After sorting lymphocite subsets, gene expression is analyzed by Fluidigm Biomark. Bottom panel describes the gating strategies and the lymphocites subsets selected for sorting and gene expression analysis. Mathematical analysis applied on the subsets in order to obtain differentially expressed genes (DEGs) and differentially induced genes (DIGs) are described.

