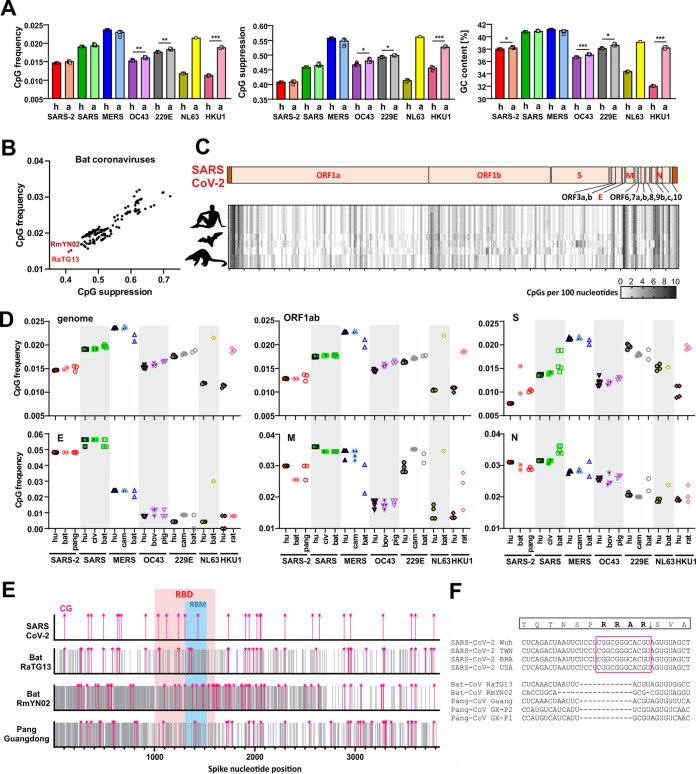
FIG 2.
CpG content and distribution in human coronaviruses and their animal relatives. (A) CpG frequency, suppression, and GC content in the genomes of human (h)-infecting and animal (a)-infecting coronaviruses. (B) CpG frequency and suppression of sequenced bat coronaviruses available in NCBI database (n = 182); close relatives of SARS-CoV-2 are shown in bright (RaTG13) and dark (RmYN02) red. Each point represents one viral strain. (C) Heat map showing the number of CpG dinucleotides, ranging from 0 (white) to 10 (black), within 100-bp sliding windows of aligned genomic sequences of SARS-CoV-2 and its closest relatives infecting horseshoe bats and pangolins. The genome organization diagram at the top represents that of the human virus. (D) CpG frequency in major genes of human and related animal coronaviruses. These genes encode viral polyproteins (ORF1ab), envelope (E), spike (S), nucleocapsid (N), and matrix (M) proteins. bov, bovine; civ, civet. (E) Schematic representation of spike nucleotide sequences of SARS-CoV-2 and its closest relatives showing the relative positions of CpGs (pink stars), receptor binding domains (RBD), and receptor binding motifs (RBM). Gray lines indicate nucleotide mismatches compared to aligned SARS-CoV-2 spike. (F) Insertion in spike of SARS-CoV-2 introducing a novel furin-cleavage site after an RRAR motif.

