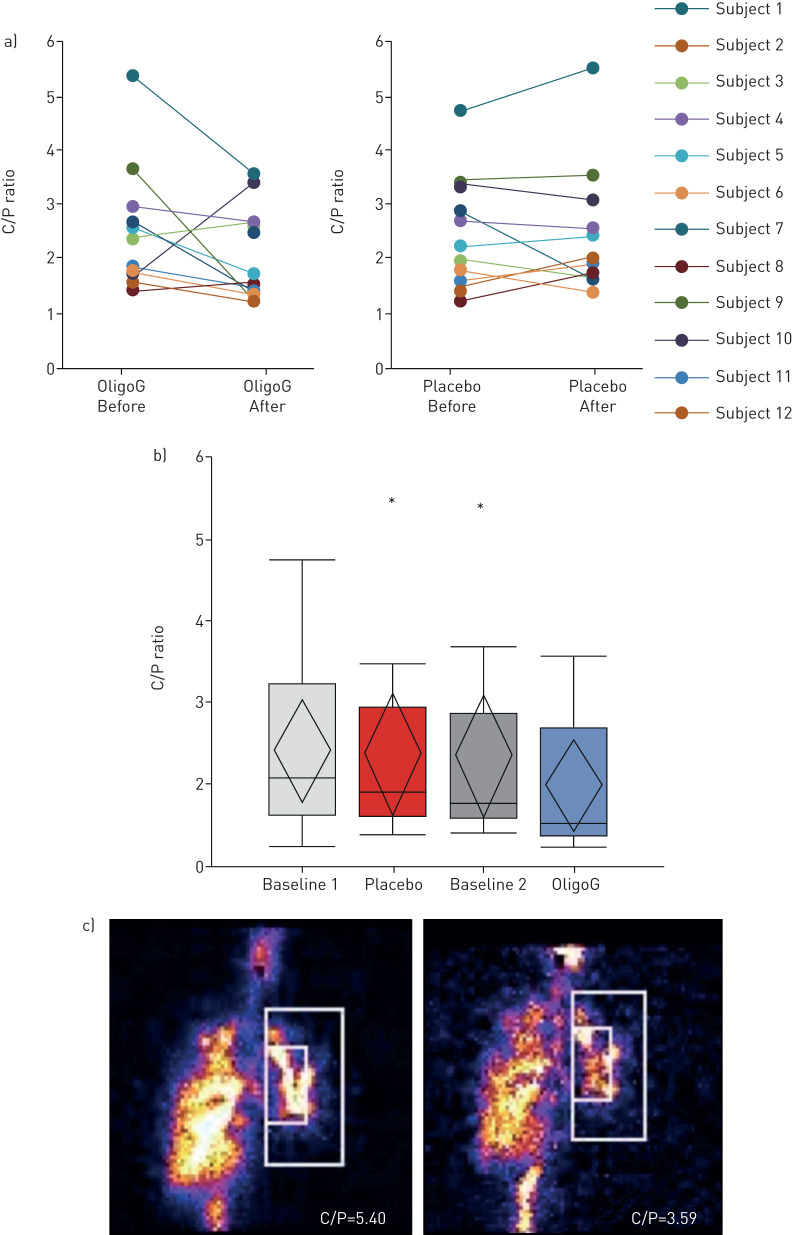
FIGURE 4.
Central/peripheral (C/P) deposition per subject. a) Scintigraphic imaging pre- and post-4 weeks’ treatment shows reduced C/P ratio with OligoG as compared to placebo; b) box plots for C/P ratio of isotope deposition at each study visit; c) example of C/P analysis from baseline and post-OligoG deposition in a person with cystic fibrosis. A trend toward more peripheral deposition was observed following OligoG treatment.

