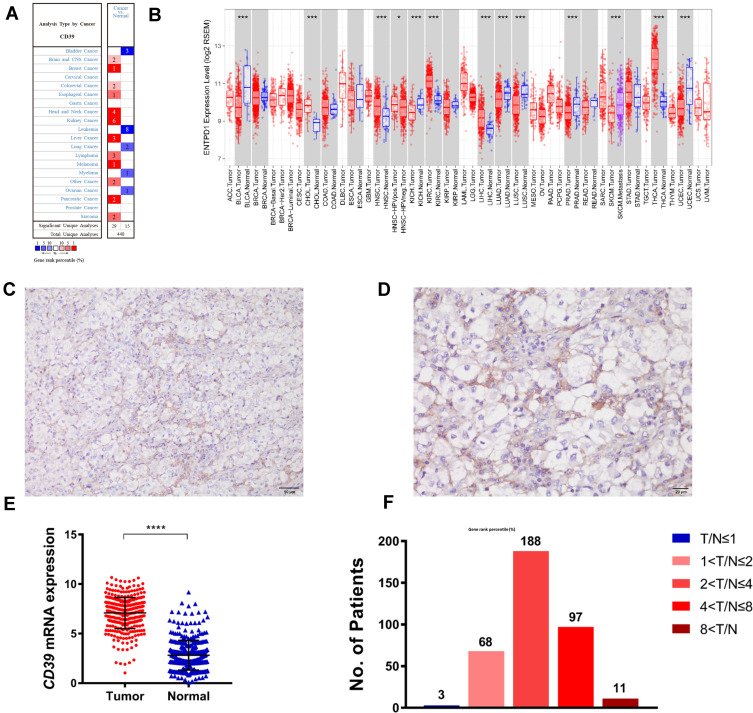
Figure 1.
Expression of CD39 in ccRCC. (A and B) CD39 expression level in different cancer types in the Oncomine database and TCGA database (analyzed by TIMER). (C and D) CD39 protein expression in ccRCC tissues (C, 200×magnification; D, 400×magnification). (E) CD39 mRNA expression in ccRCC and para-carcinoma normal tissue. (F) The percentage of different CD39 mRNA expression described by different T/N (ccRCC/normal tissue).

