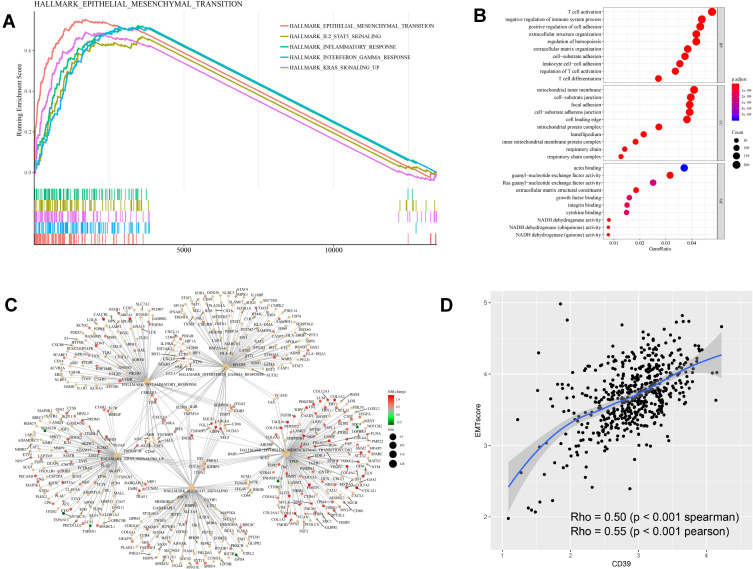
Figure 4.
Functional and gene set enrichment analysis of CD39 based on TCGA ccRCC samples. (A) Pathway enrichment analysis of DEGs based on the hall mark gene sets. (B) GO function analysis of DEGs. The top group represents BP group, the middle group represents CC group and the bottom group represents MF group. (C) DEGs gene-concept network based on the most significant hallmark gene clusters. (D) Plot of the correlation between CD39 and EMT-related gene in TCGA ccRCC samples.

