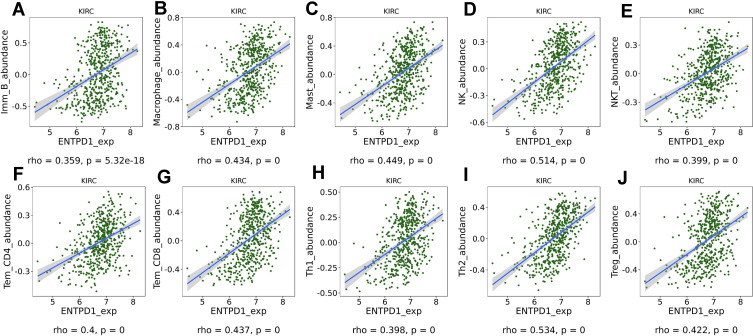
Figure 5.
Correlation analysis of CD39 expression with infiltrating immune cells via the TIMER database. CD39 expression was significantly and positively correlated with infiltrating levels of immature B cells (A), macrophages (B), mast cells (C), natural killer (NK) cells (D), natural killer T (NKT) cells (E), effector memory CD4 T cells (F), effector memory CD8 T cells (G), type 1 T helper cells (H), type 2 T helper cells (I) and regulatory T (Treg) cells (J).

