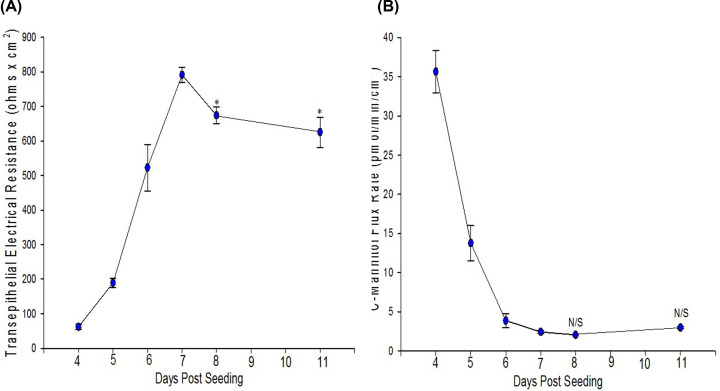
Figure 2. Time course of the development of 16HBE TER (A) and the 14C-mannitol flux rate (B).
Seeded at 1.0 × 10⁶ cells per 4.2 cm2 PCF, TER, and Jm were measured as described in ‘Materials and methods’ section beginning on day 4 post-seeding. Data shown are mean ± standard error of mean. The data are composites of multiple time courses, n=6 cell layers for days 4, 5, and 6; n=7 for days 7 and 8; n=4 for day 11. * indicates P<0.05 when compared with day 7 values; N/S, not significant when compared with day 7 (Holm–Sidak method following one-way ANOVA).

