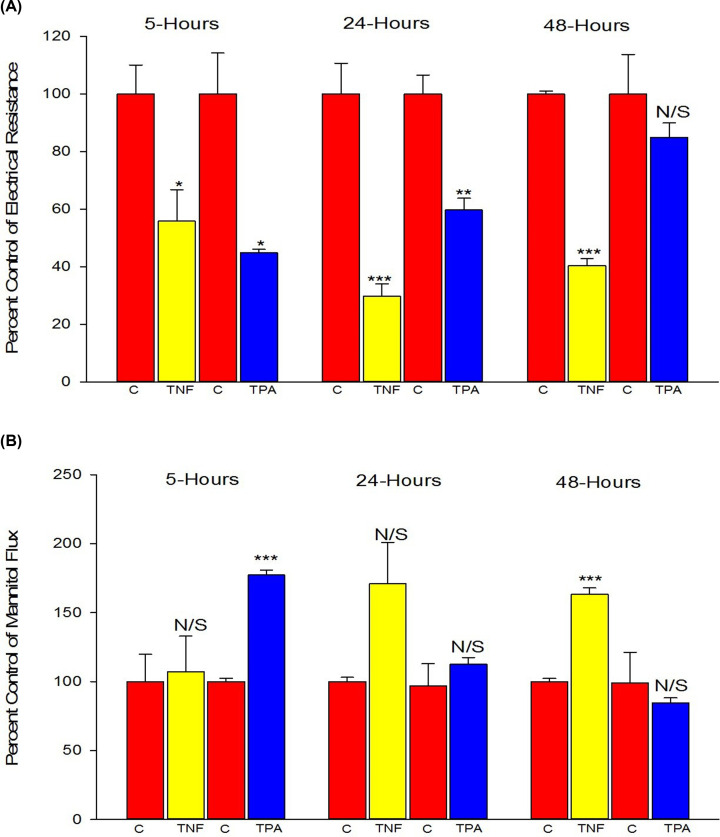
Figure 5. The effects of TNF-α or TPA on 16HBE TER (A) and 14C-mannitol flux rate (B).
Cells were seeded on day 0 at 1.1 × 10⁶ cells per 4.2 cm2 PCF for the TNF-α experiments and at 1.2 × 10⁶ cells per PCF for the TPA experiments. Treatment with 133 ng/ml TNF-α or 10−7M TPA occurred on day 6 post-seeding as described in ‘Materials and methods’ section. At 5, 24, and 48 h post-treatment, TER and Jm measurements were recorded as described in ‘Materials and methods’ section. Data are represented as percent of control group within the same experiment ± standard error for n=3 cell layers for control and TPA groups at 5 h; n=4 for each condition for the two other time points. * indicates P<0.05, ** indicates P<0.01, *** indicates P<0.001, N/S indicates not significant (treatment compared with control for that experiment, Student’s t test, two-tailed). ‘C’ indicates control conditions.

