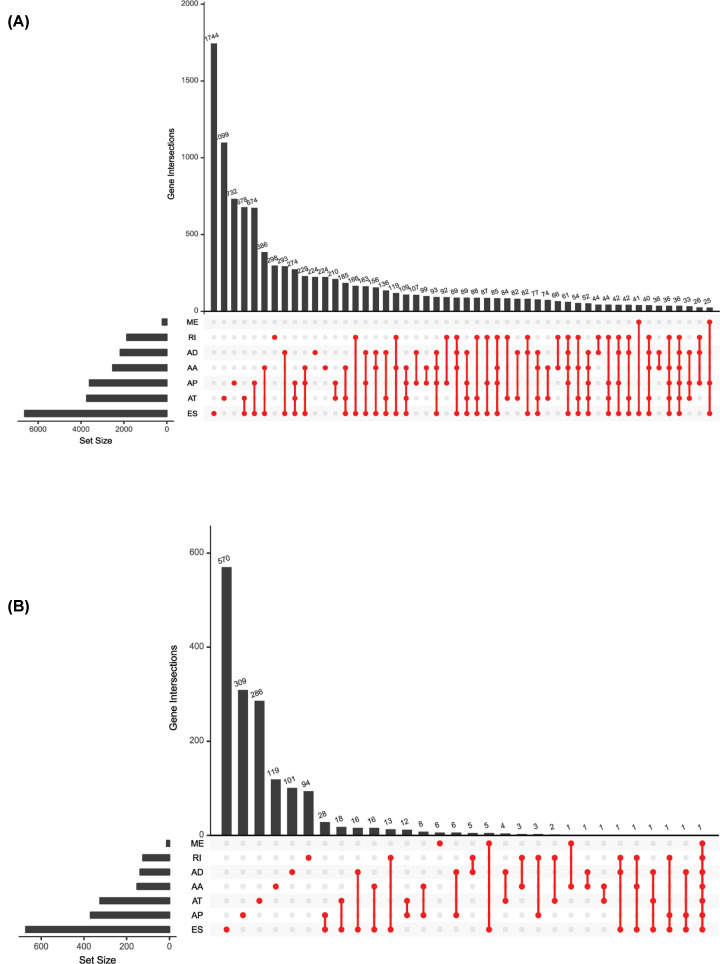
Figure 1. UpSet plots of alternative splicing (AS) events in geriatric lung adenocarcinoma (GLAD).
(A) UpSet plots of AS events in GLAD. The horizontal axis represents the number of genes in each AS type. The vertical axis represents the number of genes for one or several splicing types. (B) UpSet plots of survival-related AS events in GLAD.

