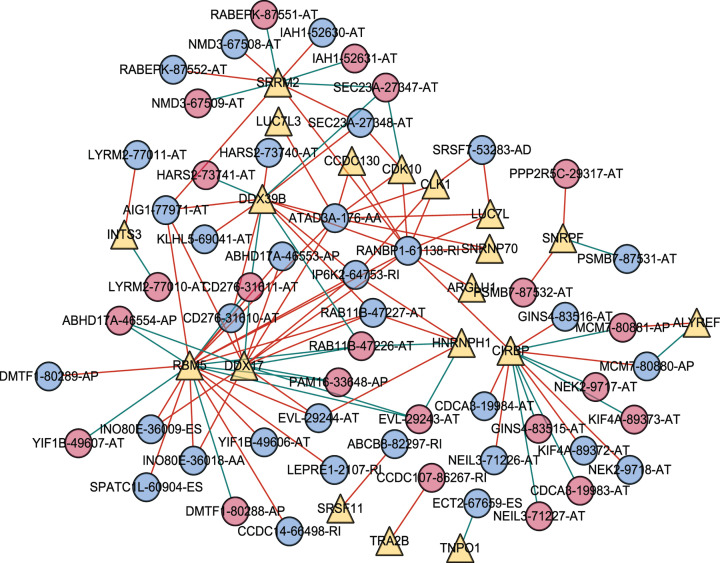
Figure 15. Correlation network between survival-associated splicing factors and splicing in geriatric patients with LUAD.
The PSI values of survival-related AS events are represented by red/blue dots. Survival-associated SFs are represented by yellow dots. The positive/negative correlations between expressions of the SFs and PSI values for AS are represented by red/green lines.

