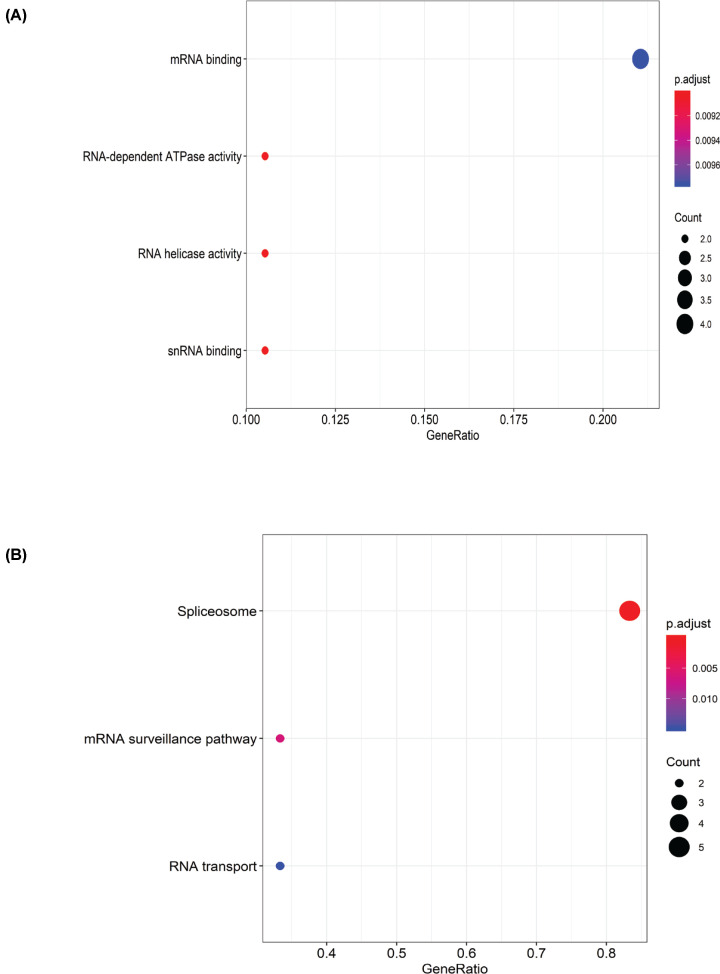
Figure 16. Biological function analysis.
(A) Terms identified by Gene Ontology (GO) analysis. The dot size represents the number of the enriched genes, and FDR values are shown by the color scale; FDR, false discovery rate. (B) Enrichment pathways identified by Kyoto Encyclopedia of Genes and Genomes (KEGG).

