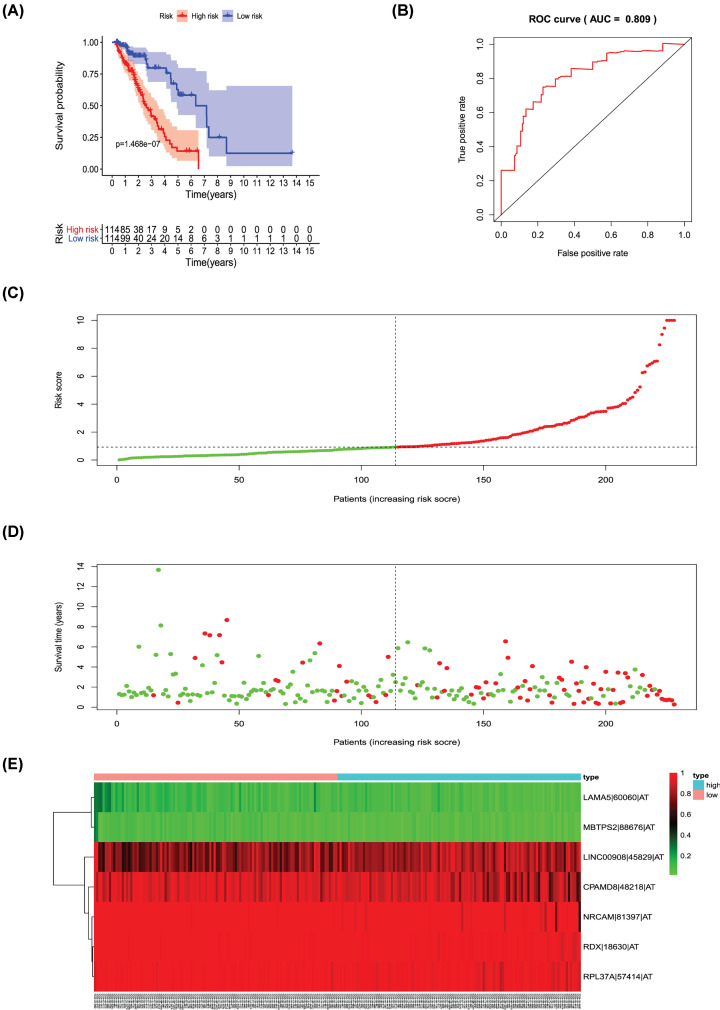
Figure 9. Analysis of the PI-AT.
The seven prognosis-associated events of AT were selected by multivariate Cox regression analysis to construct the PI-AT model. (A) The risk curve of PI for evaluating the survival time of geriatric patients with LUAD stratified by the median PI value into a low-risk and high-risk groups. (B) Time-dependent receiver-operator characteristic curve of PI for predicting the tumor status. (C) PI value curve for geriatric patients with LUAD. (D) Survival conditions and survival time of GLAD patients distributed according to risk score (green dots represent survivors; red dots represent deaths). (E) Heat map indicating the relationship between the PSI value of the AS events and the risk score.

