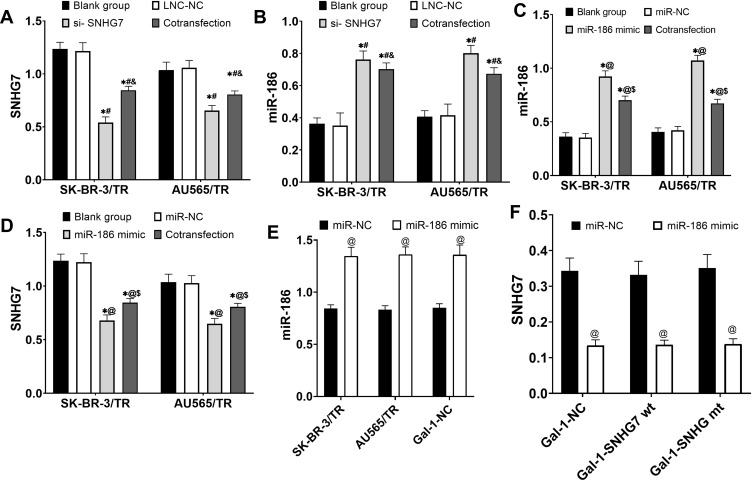
Figure 2.
Analysis of transfection results. (A) Analysis of si-SNHG7 transfection results of drug-resistant cells. (B) Effects of si-SNHG7 transfection on the expression of miR-186 in drug-resistant cells. (C) Analysis of miR-186 mimic transfection results of drug-resistant cells. (D) Effects of miR-186mimic transfection on the expression of drug-resistant cells SNHG7. (E) Analysis of miR-186 mimic transfection results in 293T cells. (F) Effects of miR-186mimic transfection on SNHG7 expression in 293T cells. * P<0.05 compared with blank group, # P<0.05 compared with LNC-NC group, and P<0.05 compared with si-SNHG7 group, @ P<0.05 compared with miR-NC group, and $ P<0.05 compared with miR-186 mimic group.

