
Figure 2.
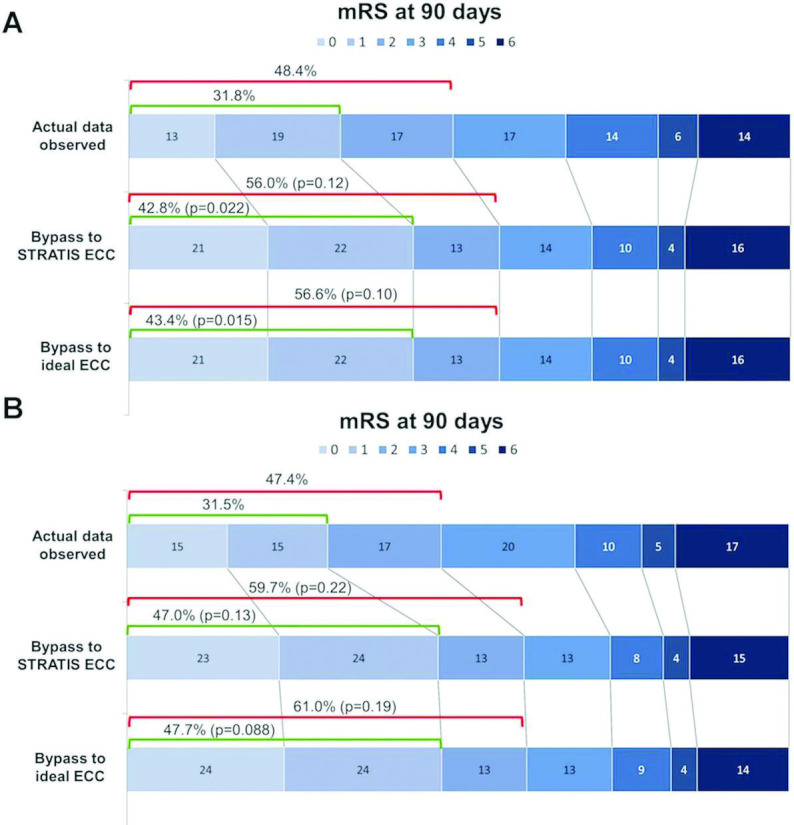
Distribution of modeled mRS outcomes at 3 months. Rows indicate actual outcomes with first ground transport to a nECC and then transfer to an ECC, modeled outcomes with first transport direct to STRATIS ECC, and modeled outcomes with first transport direct to an iECC. (A) Among the 236 patients transferred with no limitation of transfer distance. (B) Among the 62 patients transferred by ground within 20 miles of the stroke scene to an ECC (cOR 1.67 (95% CI 1.04 to 2.68]; two-sided shift test, p=0.034). ECC, endovascular capable center; iECC, ideal endovascular capable center; mRS, modified Rankin Scale; nECC, non-endovascular capable center