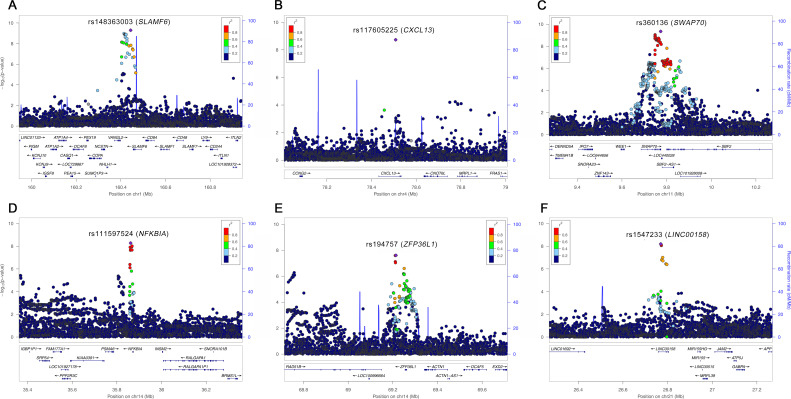
Figure 2.
Regional association plots for novel RA-associated loci. Regional association plots for the six new RA loci: (A) SLAMF6, (B) CXCL13, (C) SWAP70, (D) NFKBIA, (E) ZFP36L1 and (F) LINC00158, represent the minus log10-transformed p values for variants in each locus according to their genomic positions. The lead variants are indicated by purple points and the other variants are coloured according to r2 values with the lead variant in each locus. The names of lead variants and their closest genes are given on the top of the plots. RA, rheumatoid arthritis.

