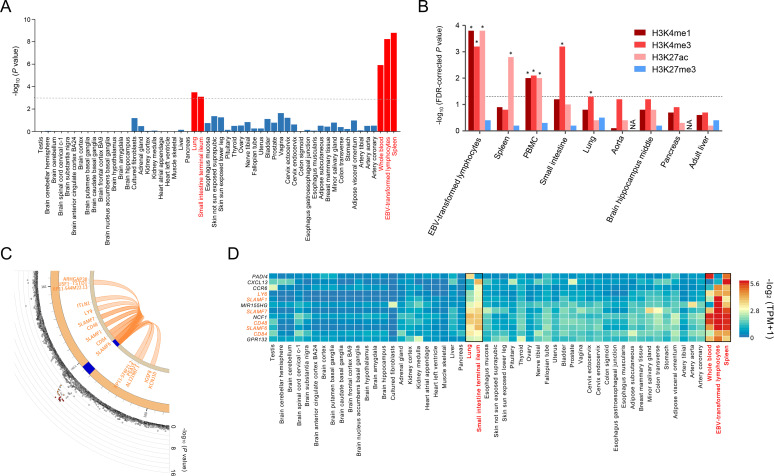
Figure 3.
Tissue-specific gene expression in RA loci including the SLAMF6 locus. (A) Tissue-specific gene expression levels in 54 GTEx tissues were analysed by MAGMA to identify tissue-specific expression of RA-associated genes. Five significant tissues (spleen, EBV-transformed lymphocytes, whole blood, lung and small intestine) are highlighted in red bars. The dashed line represents the Bonferroni-corrected significance threshold (=0.05/54). (B) Tissue-specific enrichment of RA variants within histone marks was analysed by GREGOR using Roadmap Epigenomics Project data. FDR-corrected p values for the overlap between RA-risk variants in 19 RA loci and 4 tissue-specific histone marks in 9 tissues were plotted with asterisks indicating significant enrichments with three transcription-activating histone marks in 5 tissues at the FDR threshold of 5% (represented by a dashed line). (C) The Circos plot for the SLAMF6 locus summarises the physical location (blue) with RA-risk variants and chromatin interaction (orange loops) involving both the RA-risk variant and the tissue-specific regulatory regions (including promoters and enhancers) in the five identified tissues. The outer layer in the Circos plot represents the minus log10-transformed RA association p values of variants according to the chromosomal position. The SLAMF6 variant (rs148363003) had chromatin interactions with 12 other coding genes (ARHGAP30, CD48, CD84, IGSF8, ITLN1, KCNJ10, LY9, PEA15, SLAMF1, SLAMF7, TSTD1 and USF1) on chromosome 1. (D) The heat map of gene expression levels represents the predominant expression levels of 11 prioritised RA-relevant RA genes in the 5 identified tissues (indicated by red tissue names and black box lines) among 54 tissues. The 11 RA genes that clustered in a gene expression analysis include known RA-associated genes and SLAMF genes (SLAMF6, LY9, SLAMF1, SLAMF7, CD48 and CD84). EBV, Epstein-Barr virus; RA, rheumatoid arthritis.

