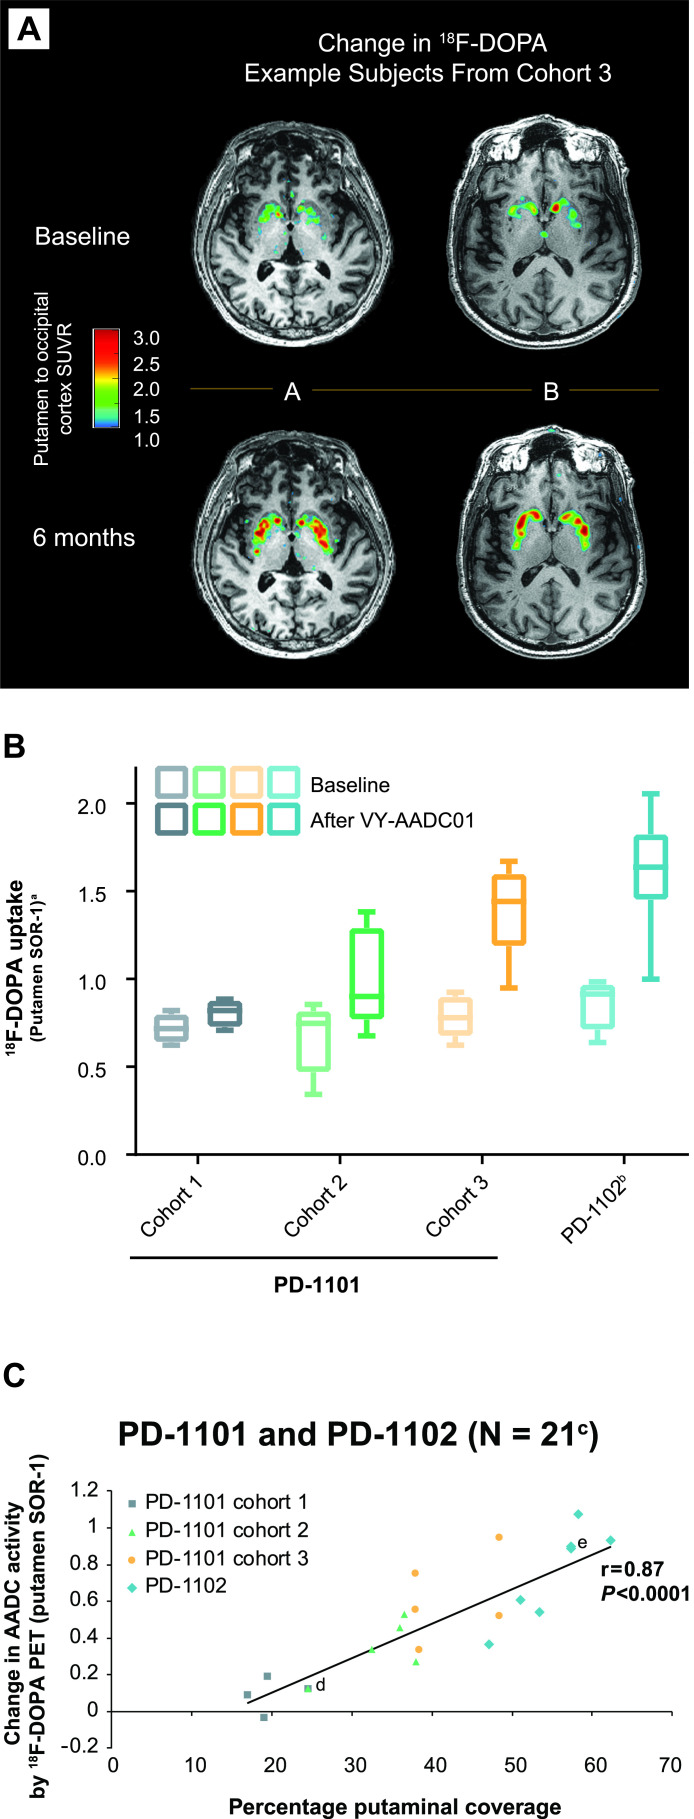
Figure 4.
AADC enzyme activity as measured by 18F-DOPA PET in individual patients from PD-1101 (A), by cohorts (baseline and at 6-month measurements) in PD-1101 and PD-1102 (B), and correlation of the change in 18F-DOPA PET with putaminal coverage measured by MRI (C). PET imaging frames captured 65–75 min after 18F-DOPA administration. Box plot in panel B shows median (middle line), 25th–75th percentiles (box) and range (bars). aSORs were calculated using bilaterally averaged occipital time–activity curve (kBq/mL) region-of-interest values in each patient. bn=7; analysis of scan for one patient in PD-1102 was confounded by movement artefact, and data for this patient were excluded. cData were not available for one patient from PD-1101 cohort 1 and one patient from PD-1102. dTwo overlapping data points from PD-1101 cohort 1 and cohort 2. eTwo overlapping data points from PD-1102. AADC, L-amino acid decarboxylase; 18F-DOPA, [18F]-fluoro-L-dihydroxyphenylalanine; PET, positron emission tomography; SOR-1, striatal-to-occipital ratio-1; SUVR, standardised uptake value ratio; vg, vector genome.

