Figure 1.
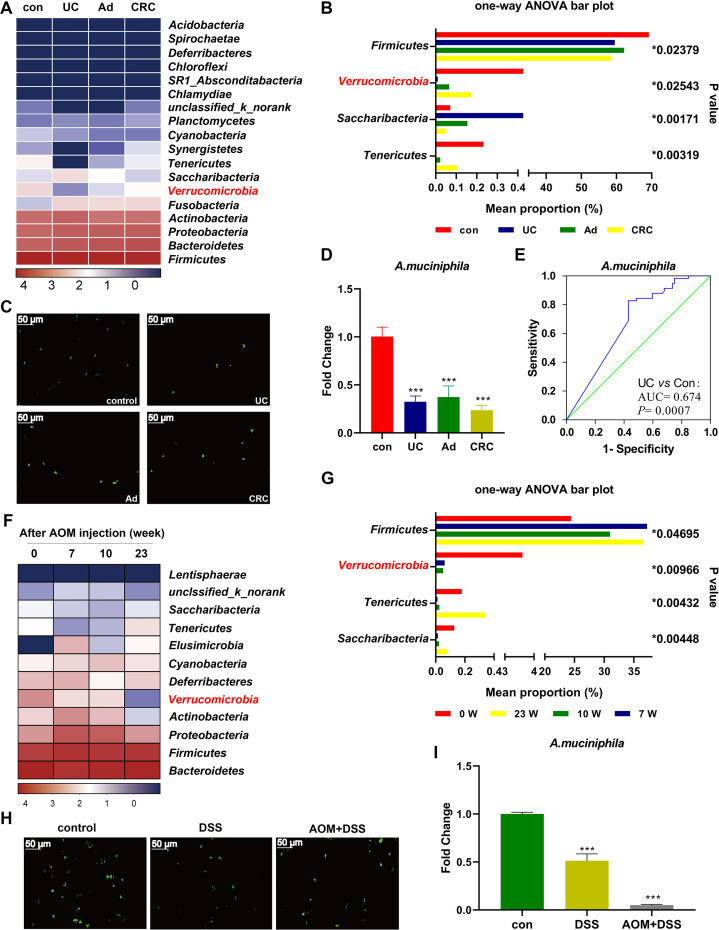
Decreased A. muciniphila was associated with colitis and CRC in human and mice. (A) Heatmap of faecal microbiota from patients with UC, Ad, CRC and healthy controls. (B) Comparison of the faecal microbiota among UC, Ad, CRC and controls at the phylum level. (C) FISH detection of A. muciniphila in the colon of human patients using a FITC-conjugated A. muciniphila specific probe (green). Scale bars, 50 µm. (D) qPCR validation of the relative abundance of A. muciniphila in human patients. (E) ROC curves of A. muciniphila in predicting UC. (F) Heatmap of faecal microbiota from mice with CAC at different time points. (G) Comparison of faecal microbiota in CAC mice at the phylum level. (H) FISH detection of A. muciniphila in the mice with colitis and CAC (at week 23). (I) The relative abundance of A. muciniphila in colitis and CAC (at week 23) mice by qPCR. Data are presented as the mean±SEM and were analysed by ordinary one-way ANOVA with Tukey’s multiple comparisons. ***P<0.001. Ad, adenoma; ANOVA, analysis of variance; CAC, colitis-associated colorectal cancer; CRC, colorectal cancer; UC, ulcerative colitis

