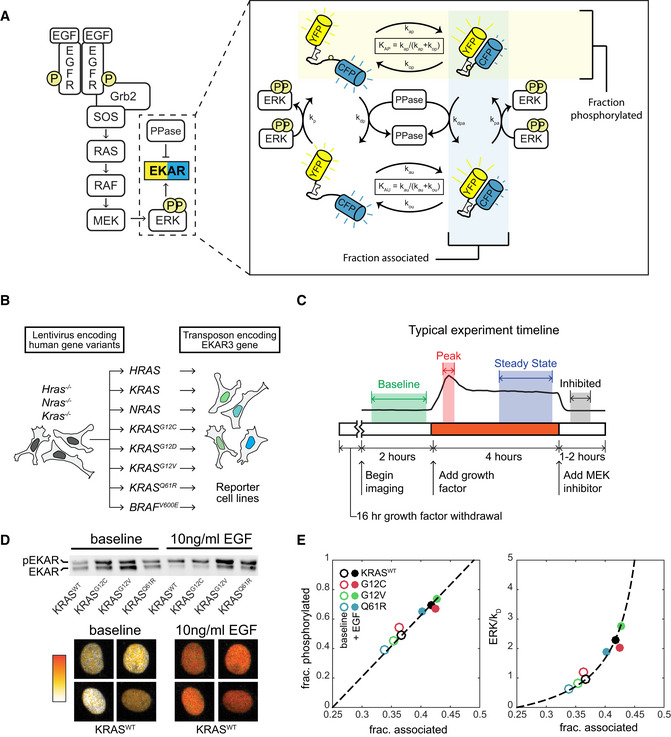
Figure 1. Platform for ERK activity measurement in MEF cell lines expressing a single RAS isoform.

- Schematic of EGF signaling through RAS to ERK, including the EKAR3 sensor. The detail image at right depicts the cycle of EKAR3 phosphorylation by ERK, binding and unbinding of the internal WW domain to the phosphorylated threonine residue, and removal of the phosphate by phosphatases. Spontaneous association of the fluorophores in the absence of phosphorylation contributes to background signal and is included in activity calculations.
- Construction scheme for cell lines bearing a single RAS isoform, using H/K/N-RAS knockouts.
- Diagram of the typical experiment timeline. Shaded regions indicate time windows that are averaged for each measurement.
- Sample calibration data for the EKAR3 reporter, consisting of Phos‐Tag immunoblot for phospho‐EKAR (upper) and live‐cell imaging of reporter FRET activity (lower) under matched conditions for 4 cell lines that span the full range of ERK activity levels. Ratiometric images of four individual nuclei from the KRASWT line, which show the largest change from baseline to peak, are shown before and after stimulus as a representative example of the image data.
- Calibration curves for ERK activity. Fraction of EKAR3 phosphorylated is shown vs. the fraction in the associated conformation by FRET (left). The ERK to phosphatase activity ratio (right) is derived from a model of EKAR3 (see Appendix Supplementary Methods). Each marker represents the mean value from one cell line with (filled circle) or without (open circle) EGF treatment, from 3 replicate live‐cell samples and 4 replicate immuno blot samples.
