
Figure EV1. Correlation of ppERK measured by anti‐ppERK antibody and calculated from Phos‐Tag.
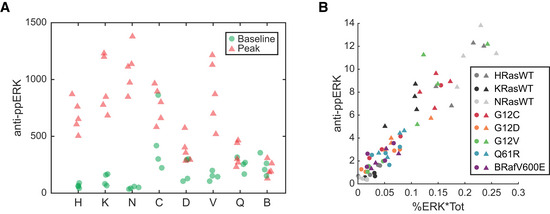
- ppERK measured in baseline and peak stimulated samples of each cell line, via immuno blot with anti‐ppERK antibody.
- Data from A, plotted against the ppERK calculated for the same samples, as percent of ERK phosphorylated (via Phos‐Tag) times the total ERK (via immuno blot with anti‐ERK1/2 antibody).