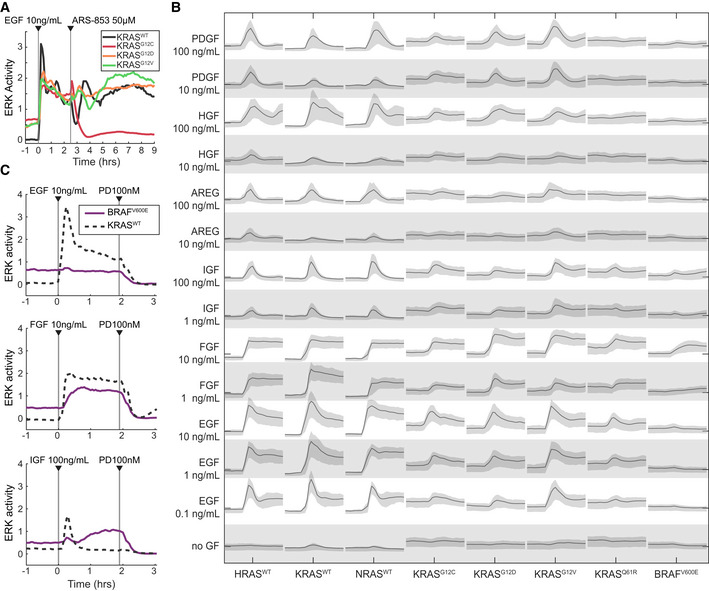
Figure 2. Activity profiles of MEF cell lines expressing a single RAS isoform.

- Demonstration of the system measuring a cell line‐specific response via ARS‐853, a RAS activity inhibitor specific to the KRASG12C mutant. Traces are median values from a representative experiment. Experiment was replicated 3 times.
- Graphical summary of single RAS isoform cell lines (labeled along bottom) stimulated by a panel of growth factors (labeled along left). Each panel of the matrix shows the time series of ERK activity with the indicated growth factor spiked in after beginning imaging. All scales are equal; x‐axis: time; y‐axis: ERK activity. Lines indicate median of single‐cell measurements over time, and shaded regions denote the 25th–75th percentile region, across 3 replicate cultures (6 for no GF).
- Demonstration of RAS‐independent activity from ligands other than EGF, evidenced by response in the BRAFV600E cell line lacking H/K/N-RAS. Traces are median values from a representative experiment. Experiment was replicated 5 times.
Source data are available online for this figure.
