-
A–E
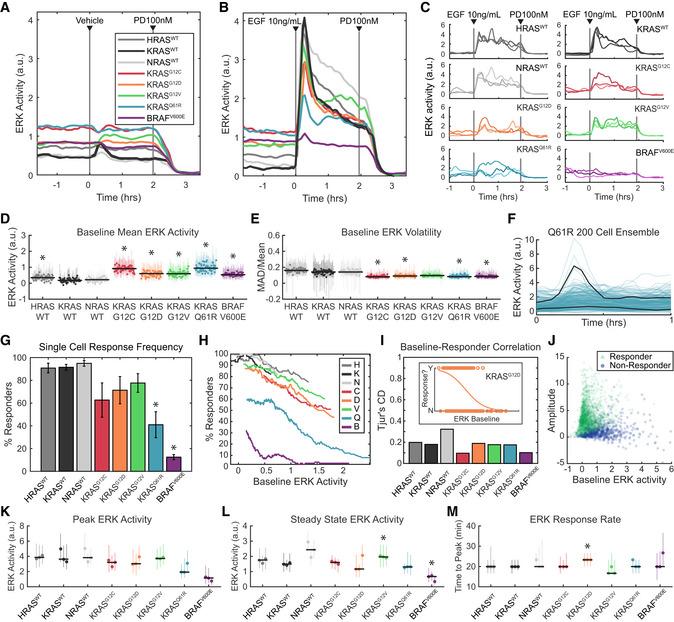
ERK activity in each of the 8 MEF cell lines, after growth factor withdrawal for 16–24 h, followed by stimulus consisting of (A) media only, or (B) 10 ng/ml EGF. (A, B) Mean values over 3 replicate cultures. (C) Three example single‐cell traces per cell line, randomly selected from 3 replicate experiments. (D) Average baseline (pre‐stimulus) ERK activity over 58 replicate cultures per cell line. Each dot represents the median value across cells in an experiment and vertical lines represent the 25th–75th percentiles. Black horizontal bars denote the median across all replicates. Asterisks indicate significance by t‐test (pFDR < 0.05). (E) Average volatility (pre‐stimulus) over 58 replicate cultures per cell line, reflecting the scale of variation over time, displayed as in D. Dots show medians and error bars show 25th–75th percentiles. Asterisks indicate significance by t‐test (pFDR < 0.05).
-
F–J
Analysis of single‐cell response likelihood after EGF stimulus. (F) Demonstration of many cells not responding to EGF stimulus in the Q61R cell line, in a representative experiment. Black lines highlight one responder and one non‐responder cell, with 200 individual cell traces shown. (G) Likelihood of single cells responding to EGF stimulus, for each cell line, showing mean of 3 replicates with error bars showing one standard deviation. Asterisks indicate significance by t‐test (pFDR < 0.05). (H) Relationship between response likelihood and average baseline ERK activity as a possible correlate, for each cell line. Means taken over 3 replicate cultures. (I) Weakness of correlation between baseline ERK activity and response likelihood, measured by Tjur's coefficient of discrimination (i.e., correlation coefficient for a binary response). Inset shows an example from the KRASG12D mutant, where dots are scattered per cell by baseline ERK activity (x‐axis) and whether that cell responded to EGF (binary y‐axis). Orange line indicates the logistic fit. Correlations calculated from single‐cell data from 3 replicate experiments. (J) Scattered single‐cell measurements of baseline ERK activity and amplitude of the change after EGF stimulus. Green triangles: cells that responded; blue circles: cells that did not respond.
-
K–M
Analysis of the response to EGF, by filtering to remove cells that do not respond, presented as in (D), with dots showing medians and error bars showing 25th–75th percentiles. Asterisks indicate significance by t‐test (pFDR < 0.05). Data from 3 independent culture replicates. (K) Peak ERK activity reached after EGF stimulus. (L) Average ERK activity after 2 h in the presence of EGF. (M) Delay between EGF stimulus and peak ERK activity.
”.

