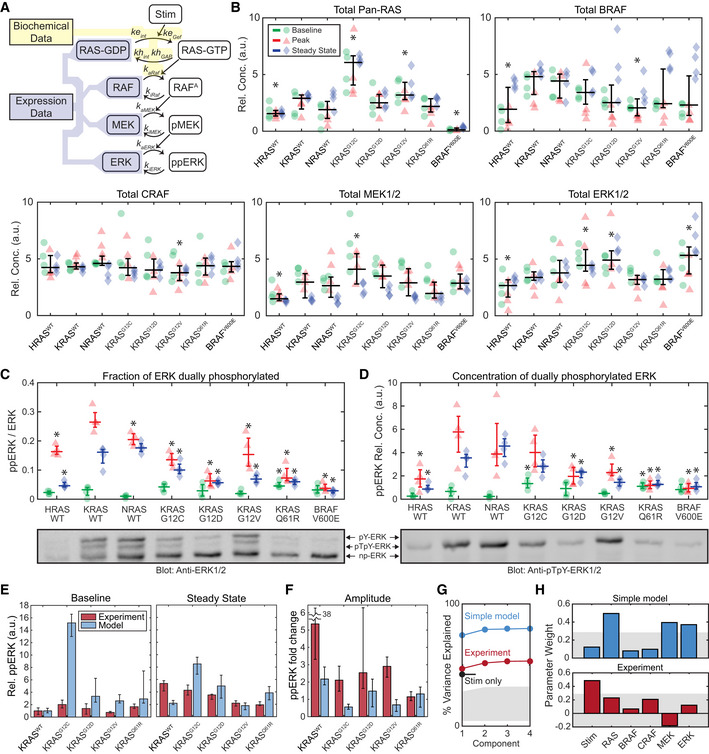
Figure 5. Quantitative analysis of ERK phosphorylation in response to RAS mutation.

-
ASchematic of a model of the internal factors of the RAS‐ERK pathway, showing parameters associated with each reaction. Shaded regions indicate portions of the model for which parameter values are available from either (yellow) published biochemical assays or (blue) our immunoblot expression data (B–D).
-
BImmunoblot measurement of RAS‐ERK pathway components in each cell line, at baseline (green circles), peak activity (15 min, red triangles), and steady‐state activity (2 h, blue diamonds), four replicates each. Overlaid plots indicate the median (horizontal bars) and 25th–75th percentiles (vertical whiskers) over all conditions. Asterisks indicate statistical significance from the KRASWT cell line, by t‐test (pFDR < 0.05).
-
C, DPhos‐Tag immunoblot measurement of ERK fractional phosphorylation (C) and the relative concentration of dually‐phosphorylated ERK (D), annotated as in (B), but with median and percentile ranges indicated per treatment condition, for 4 replicate cultures. Sample blot imagery shows anti‐ERK1/2 (below C) and anti‐ppERK1/2 (below D) for the same blot replicate. Asterisks indicate significance by t‐test (pFDR < 0.05) from the KRASWT cell line measurement for each condition.
-
E, FComparison of the internal RAS‐ERK model to experimental data. (E) Relative ppERK as predicted by the internal model and measured by immunoblot for the 4 replicates collected, showing the median of the baseline and steady state after EGF treatment (E), and the amplitude of stimulation (F). Error bars show 25th–75th percentiles.
-
G, HPartial least squares regression of both experimental ppERK measurements and predictions via the simple RAS‐ERK model. Regression was based on presence/absence of EGF, and expression levels of RAS, BRAF, CRAF, MEK, and ERK. (G) Percent of variance explained by each PLS model considered, based on how many component terms are allowed. Stim only refers to a PLS model using experimental ppERK data, but only predicting based on the presence/absence of EGF. (H) Weights assigned to each parameter in the PLS models. Gray shaded regions indicate the bounds of statistical significance, determined via bootstrapping with scrambled data. Only values that extend beyond the gray regions are statistically significant from zero (P < 0.05).
Source data are available online for this figure.
