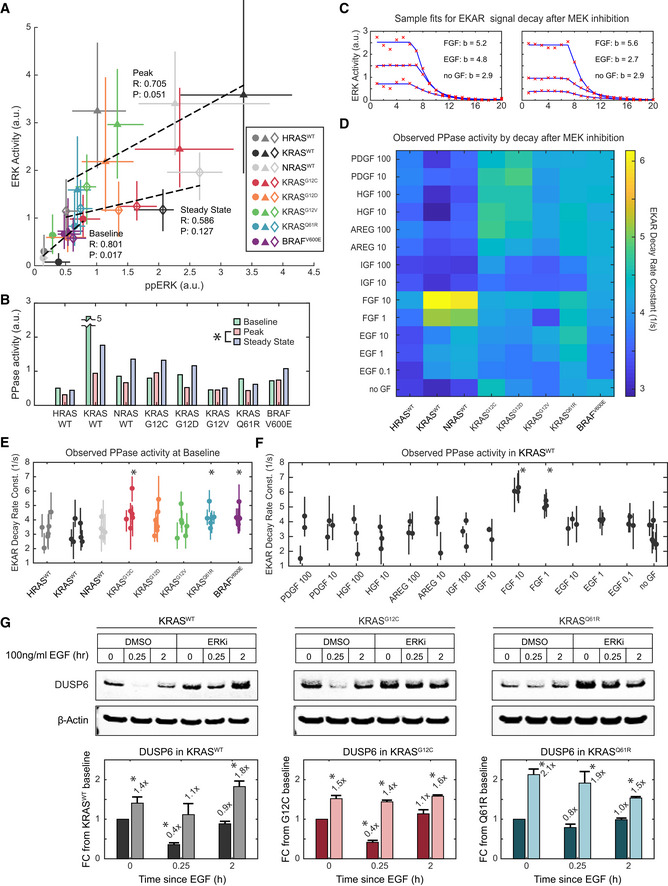
Figure 6. Inference of phosphatase activity on ERK substrates.

-
ACorrelation of ERK activity and ppERK concentration, median of 3 and 4 replicates, respectively, per condition. Error bars denote 25th–75th percentiles, including single‐cell distributions for ERK activity. Markers are color‐coded by cell line, and marker shape indicates treatment (circle: baseline, triangle: peak, diamond: steady state). Dotted lines show linear regression for each treatment; Pearson's correlation coefficients (R), and associated P‐values (P) are printed alongside.
-
BEstimate of substrate level phosphatase activity per cell line and treatment, calculated as ppERK/ERK activity. Asterisk indicates significance when comparing all cell lines, by t‐test (pFDR < 0.05).
-
CEKAR signal decay after MEK inhibition, example single‐cell data (red x's) fit to a decaying exponential model (blue lines), with decay rate constants (b) printed.
-
DHeatmap of median decay rate constants fit for each cell line and treatment.
-
E, FStatistical analysis of phosphatase activities observed by EKAR signal decay at (E) baseline (i.e., no GF treatment prior to MEKi) for all cell lines compared with KRASWT, with 6 replicates, and (F) in KRASWT for all treatments, compared with no GF, with 3 replicates. Dots denote median values, and bars 25th–75th percentiles. Asterisks indicate significance by t‐test (pFDR < 0.05); t‐tests performed as detailed in Methods and Protocols “Statistical Analysis: t‐tests for Single‐Cell Data”.
-
GImmunoblot analysis of DUSP6 levels, subject to stimulation by EGF and inhibition of ERK by 100 nM SCH772984. Bars represent the mean of triplicate measurements and error bars the standard error of the mean. Asterisks indicate statistical significance by t‐test (P < 0.05).
Source data are available online for this figure.
