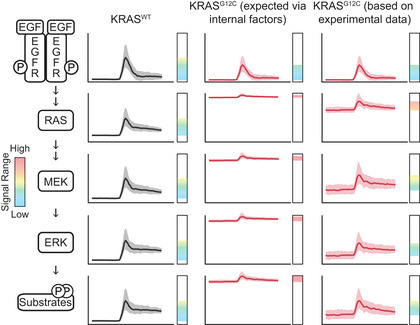
Figure 7. Rescaling and expansion of dynamic range through the RAS/ERK pathway.

Diagram depicts the activities we expect at various levels in the RAS/ERK pathway, as time series in our typical EGF stimulation experiment, extrapolated from our live‐cell data and immunoblot measurements. From left to right, columns depict the response in KRASWT, the expected response in KRASG12C cells (as an example KRAS mutant) considering only the internal factors of the RAS‐ERK pathway, and observed behavior of KRASG12C cells. Vertical bars indicate the dynamic range of the activity of that node in the network, with the colored spectrum indicating signal levels from low (blue) to high (yellow‐orange) and excessive (red).
