
Fig. 7.
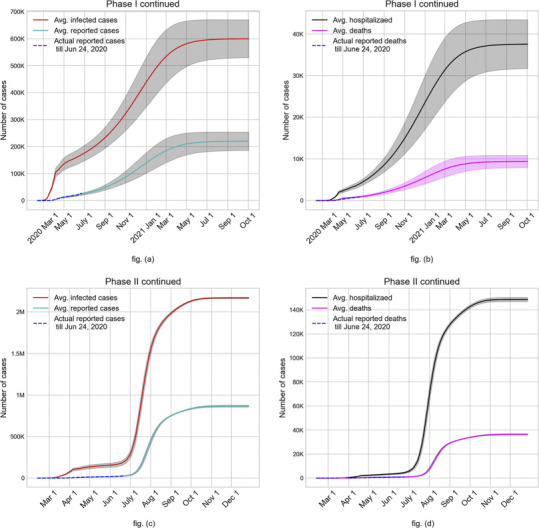
Case study outcomes (average values with 95% C.I.) of continuing with Phase I reopening (fig. (a) and fig. (b)) and Phase II reopening without face mask and contact tracing (fig. (c) and fig. (d)).
Official websites use .gov
A
.gov website belongs to an official
government organization in the United States.
Secure .gov websites use HTTPS
A lock (
) or https:// means you've safely
connected to the .gov website. Share sensitive
information only on official, secure websites.
Case study outcomes (average values with 95% C.I.) of continuing with Phase I reopening (fig. (a) and fig. (b)) and Phase II reopening without face mask and contact tracing (fig. (c) and fig. (d)).