
Figure 6.
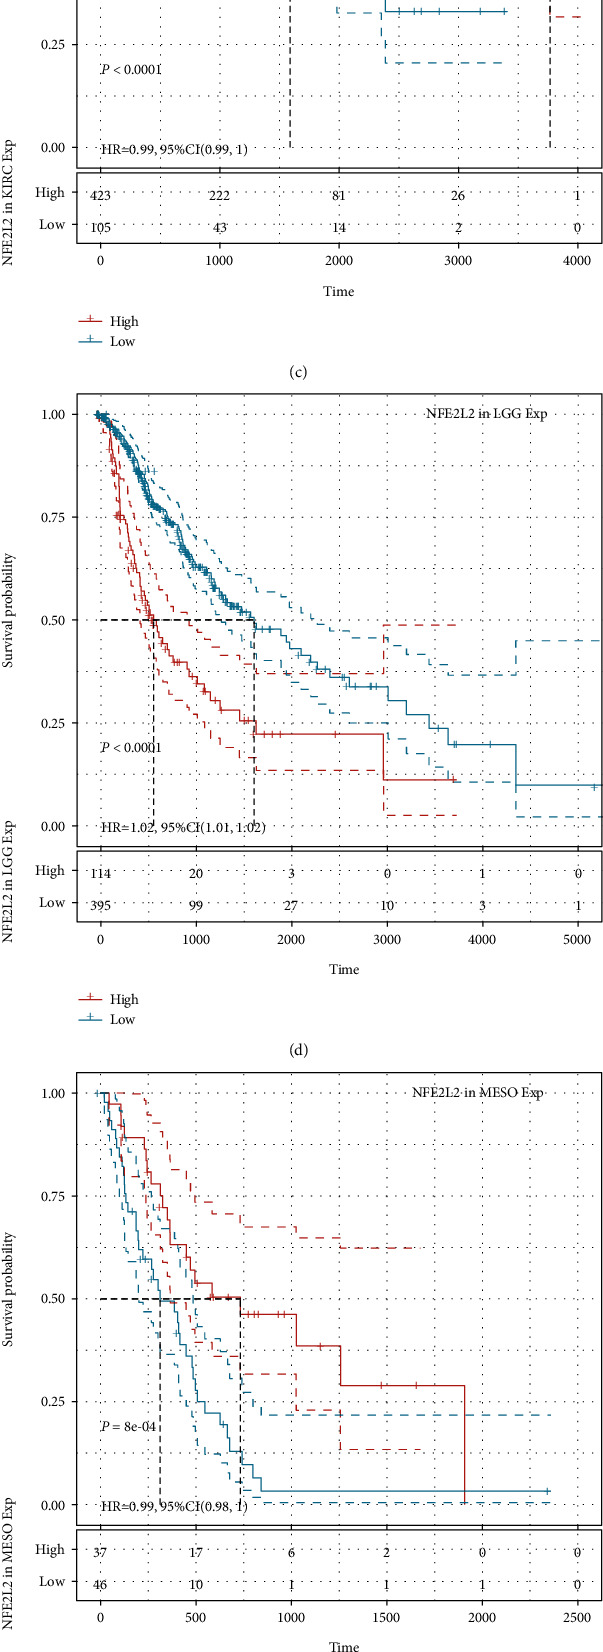
Relationship of NFE2L2 expression with patients' PFI. (a) Forest plots showing the HRs related to NFE2L2 expression in 33 cancer types. (b–g) Kaplan-Meier PFI curves for patients stratified by different expression levels of NFE2L2 in 6 cancer types.