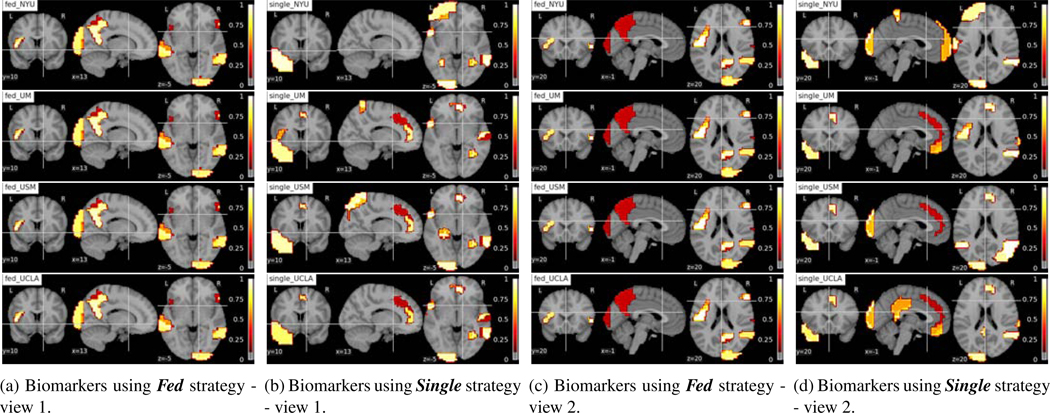
Fig. 10:
Interpreting brain biomarkers associated with identifying HC from federated learning model (Fed) and using single site data for training (Single). The colors stand for the relative importance scores of the ROIs and the values are denoted on the color bar. The names of the strategies and sites are denoted on the left-upper corners of each subfigure. Each row shows the results of NYU, UM, USM, UCLA site from top to bottom.

