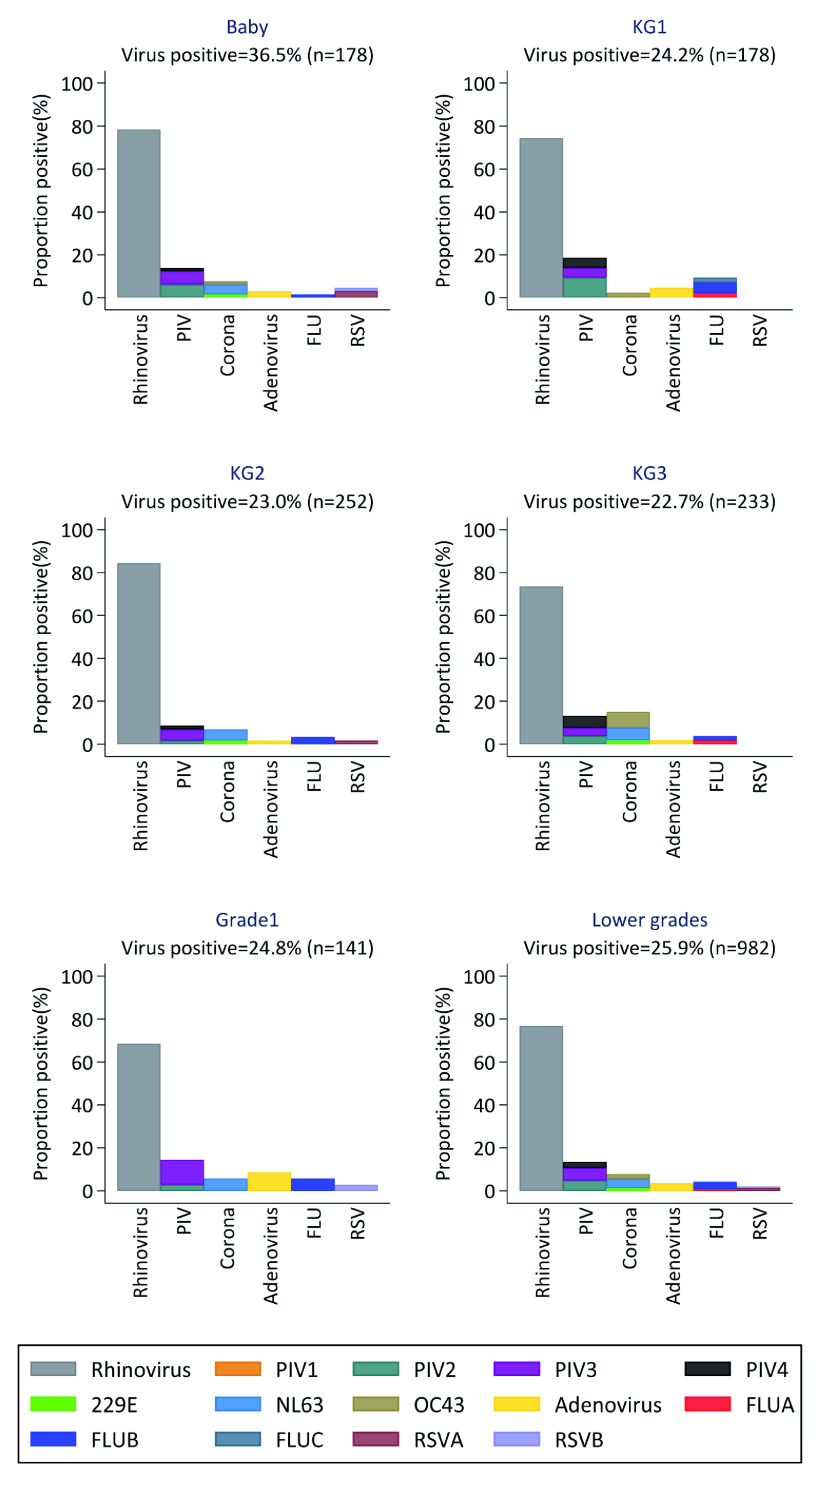
Figure 3. Proportions of virus positive samples in each of the grades in lower primary.
Each panel shows the distribution of the six different virus groups per grade. (RSV- respiratory Syncytial Virus; FLU- Influenza virus A, B, C; PIV -Parainfluenza virus 1-4; Corona- Human coronavirus NL63, E229, OC43; Rhinovirus-Human rhinovirus).

