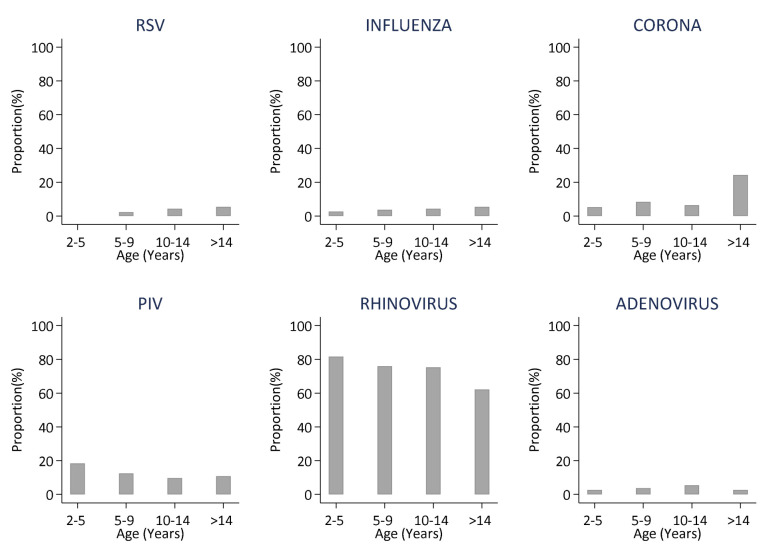
Figure 2. Distributions of the six different virus groups detected in samples collected from school children over a one school year stratified by age.
Proportions (%) are the number positive out of the number of samples collected, by age group., (RSV- respiratory Syncytial Virus; FLU- Influenza virus A, B, C; PIV -Parainfluenza virus 1–4; Corona- Human coronavirus NL63,E229,OC43; Rhinovirus-Human rhinovirus).

