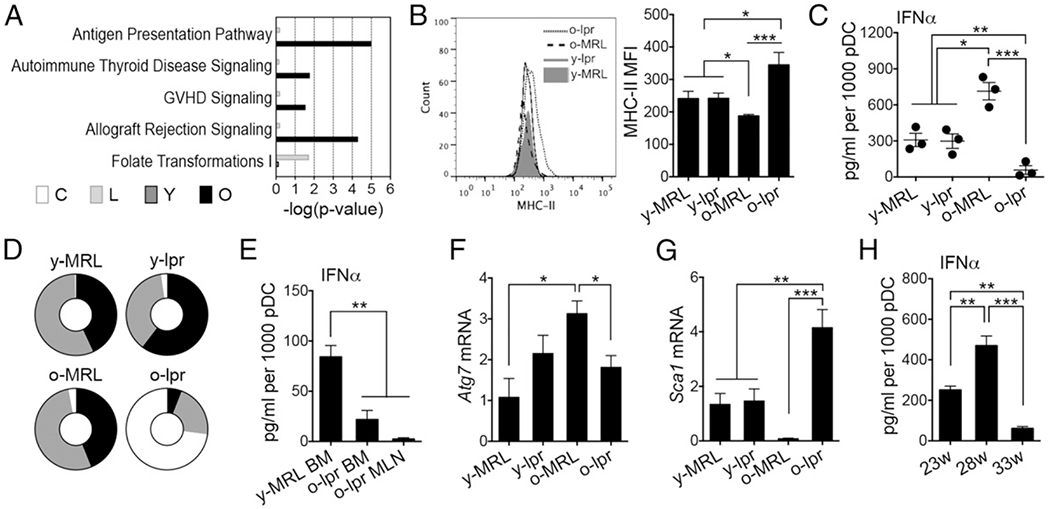
FIGURE 2.

pDCs from late-stage lupus mice unable to produce IFN-α upon CpG stimulation. (A) Ingenuity pathway analysis showing the top canonical pathways. (B) MHC-II expression on bone marrow pDCs. (C) Production of IFN-α in sorted bone marrow pDCs upon CpG stimulation for 6 h. (D) Distribution of pDCs among bone marrow (black), spleen (gray), and mesenteric lymph node (white). (E) Production of IFN-α from sorted pDCs upon CpG stimulation for 6 h. (F) Transcript level of Atg7 in sorted pDCs. (G) Transcript level of Sca1 in sorted pDCs. (H) Production of IFN-α from bone marrow pDCs from 23-, 28-, and 33-wk-old NZB/W F1 female mice upon CpG stimulation for 6 h. *p < 0.05, **p < 0.01, ***p < 0.001, ANOVA, n ≥ 3 mice/group. BM, bone marrow; C, older versus younger MRL; L, older versus younger lpr; MFI, mean fluorescence intensity; MLN, mesenteric lymph node; o, older; O, older lpr versus older MRL; y, younger; Y, younger lpr versus younger MRL.
