
Fig. 4.
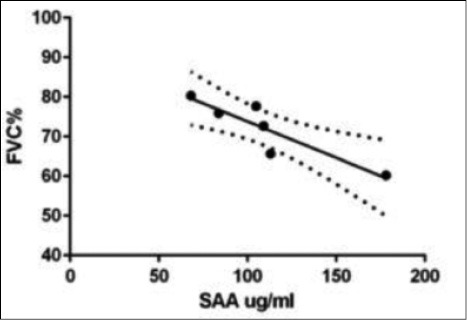
Negative statistical correlation between SAA and FVC (% of predicted) values in LTX patients with acute rejection (r -0.94, p = 0.01).
Official websites use .gov
A
.gov website belongs to an official
government organization in the United States.
Secure .gov websites use HTTPS
A lock (
) or https:// means you've safely
connected to the .gov website. Share sensitive
information only on official, secure websites.
Negative statistical correlation between SAA and FVC (% of predicted) values in LTX patients with acute rejection (r -0.94, p = 0.01).